-
-
October 30, 2023 at 5:51 pm
wen_liu
SubscriberMy case is that water passes through our device at steady state; below I showed a cylindrical shell which is part of our device; water firstly surrounds the outside of the shell, and enters through the small windows on the shell. In post processing, I am interested to know the flow rate at each window.
In CFD-post, what I did is going to turbo - define global rotation axis (in this case, it is y-axis) - calculate velocity components. Then I went to functional calculator, selected the location as the interface of each window (see the zoom-in view, the surface circled by yellow lines), calculated the area average of velocity_radial on this surface, and area of the surface. Then I can get a value by multiplying the average radial velocity with surface area. Does this value accurately represent all the flow rate into the surface?
-
October 31, 2023 at 4:12 pm
Rob
Forum ModeratorNot quite. If you multiply area average velocity you won't account for having more mass coming in through the "faster" bits. Isn't there a flux report in CFD Post?
-
October 31, 2023 at 6:11 pm
wen_liu
SubscriberHi Rob, thanks for your reply. Can you specify where I can calculate flux at a selected internal surface? Becuase I just tried in CFD post, using the functional calculator, selected location as inlet, selected variable as Mass Flow, and calculated the area_avg, but the number doesn't match the boundary condition I set at inlet.
Also, can you explain more about what part of mass flow I missed using an area_average radial velocity multipled by area? Thank you!
-
-
November 1, 2023 at 8:31 am
Rob
Forum ModeratorNot sure as I never use CFD Post - there should be some pre-built reports which includes mass flux. I post process everything in Fluent. The only issue in Fluent on interior faces is aligning the facet normals, as interior faces don't do this automatically. Sum of radial velocity * facet normal area should work too.
For flow boundaries if you look at the mass or area average you can get a different result. For flux it's probably less of an effect, but for (example) temperature if you return area average you'll miss that the highest flowrate also carries the most mass so you can miss represent the mean temperature of what's leaving the domain.
-
November 1, 2023 at 3:41 pm
wen_liu
SubscriberThanks for the explanation. I did find how to generate flux report in Fluent, but then I got even more confused, becuase
(1) the flux value calculated in Fluent doesn't match the [radial velocity * area] value on the same surface in CFD post;
(2) the flux values don't match the trend I see from the streamline/pathline plot.
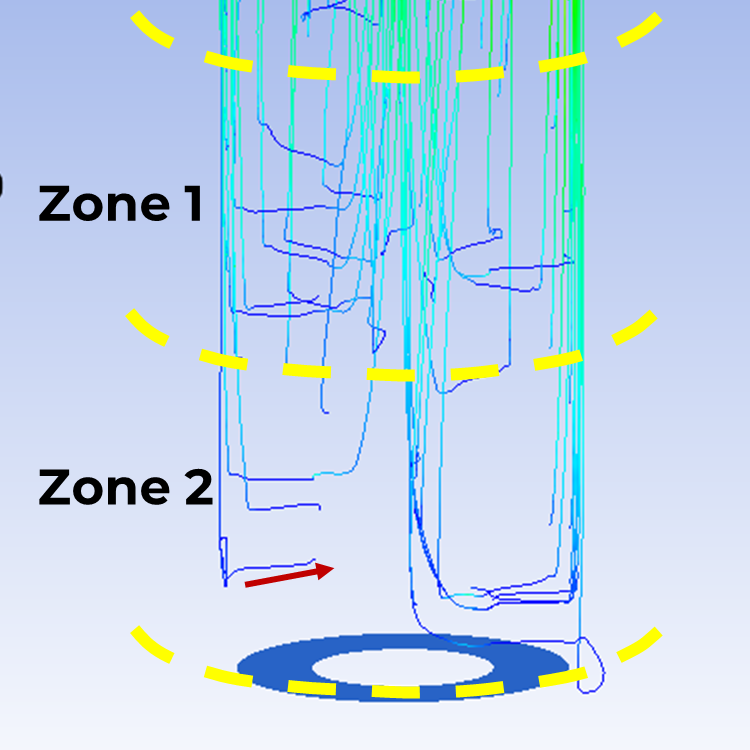
For the 2nd point, see figures below: this is part of my streamline plot, which I use for a qualitative visual comparison; I add a red arrow to show that the centripetal direction is the flow I want. The visual difference between flow going in Zone 1 and Zone 2 is very huge, definitely more flow going into Zone 1 than Zone 2. I undertsand that streamline is probably an exaggerated comparision since it is not showing all the flows. But after I generated the flux report in Fluent, I found the flux value in Zone 2 is actually higher than Zone 1.
If using the method of radial velocity multiplied by area in CFD post, I got higher flux in Zone 1 than Zone 2, same trend with streamline, although the difference is much smaller than I expected.
I'm very confused now: is my interpretation of the streamline plot wrong? And why did CFD post and fluent give me opposite trends?
-
-
November 1, 2023 at 3:53 pm
Rob
Forum ModeratorStreamlines follow the flow, but depending on where you released them from they may or may not be attached to the flow that goes through the lower ports.
Did you align the normals before getting the flux in Fluent? https://ansyshelp.ansys.com/account/Secured?returnurl=/Views/Secured/corp/v232/en/flu_ug/flu_ug_FluxReport.html
-
November 1, 2023 at 4:27 pm
wen_liu
SubscriberThanks for reminding; I actually don't know how to align surface normals in this case; the global coordinate is Cartesian but the flow zone I'm interested in is a cylinder, and in a cylindrical system, the surface normal would be the radial direction pointing to the rotation axis. (I checked the link you sent I think it is more about how to generate flux reports?)
-
-
November 1, 2023 at 5:19 pm
Rob
Forum ModeratorThere is a note there about extra steps. The alignment will point the facets in one or other directions so if each surface has a unique name it should be OK.
-
November 1, 2023 at 6:14 pm
wen_liu
SubscriberThanks for the pointer. Bear with me, I'm new to Fluent and just want to double-check about the details:
All the surface of my interest are interior boundaries; I followed the note to change them to wall boundaries, is it all required to do to align the surface normals? I didn't see anywhere I can input a specific direction for the normal vector of each surface.
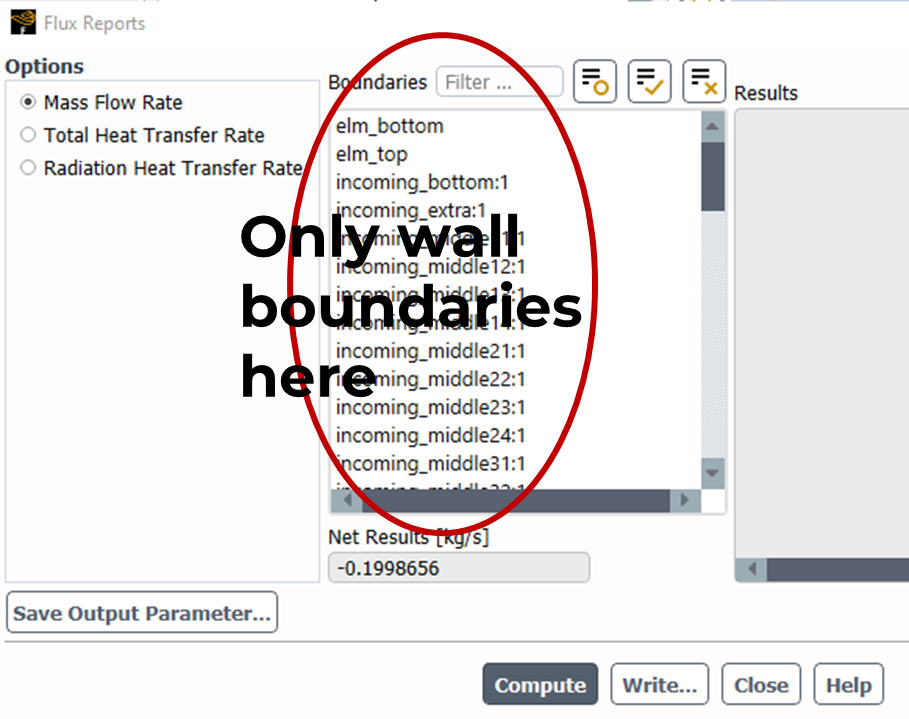
An additional questions: In Flux Reports, I can only see surfaces which are set as Wall; if I change them back to Interior, they disappear from Flux Reports and I can only calcuate their flux through Surface Integral - Mass Flow Rate. Is there some setting I can change to get interior boundaries showing up on Flux Reports as well?
-
-
November 2, 2023 at 12:14 pm
Rob
Forum ModeratorThat's odd, they're showing correctly on my test model. If those are walls, where is the shadow?
-
November 2, 2023 at 1:13 pm
wen_liu
SubscriberHi Rob, if I change an interior boundary to wall, there will be two boundaries actually added to Walls, one of them is shadow. Is this step all required to align the surface normals?
-
-
November 2, 2023 at 2:10 pm
Rob
Forum ModeratorYes, then turn them back into interior zones.
-
November 2, 2023 at 2:14 pm
wen_liu
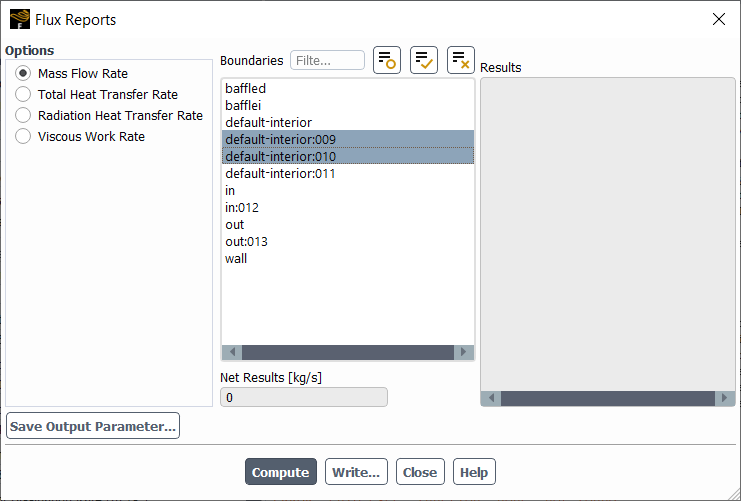
SubscriberOkay then that's the problem; once I turn them back into interior zones then they are no longer in the Flux Report panel.
And I calculated their flux (through Surface Integral) after the alignment, there is no difference before and after, which means the Fluent flux results is still opposite to the trend I saw in streamline or the raidal velocity results I got from CFD-post...
-
-
November 2, 2023 at 2:44 pm
Rob
Forum Moderator-
November 2, 2023 at 4:26 pm
wen_liu
SubscriberIf to set this question aside (as I can still calculate mass flow rate from Surface Integral if I cnanot use Flux Reports after alignment), the major problem for me is that Fluent results still are contradicting my streamline plot and CFD post results. Now I don't know which one is reliable, how I can draw conclusions for my case.
-
-
November 2, 2023 at 4:40 pm
Rob
Forum ModeratorPathlines follow the flow, but don't diffuse. As I have no idea where you released them from it's difficult to comment. If you release reverse pathlines from the outlet what do you see?
If you have a unique surface for each hole, and sum the total does it agree with the total mass flow?
-
November 2, 2023 at 4:51 pm
wen_liu
SubscriberI release the pathline from inlet usually; when you are saying pathlines don't diffuse, do you mean pathlines tend to show higher velocity flows, not lower velocity ones?
In thie case we are disucssing, Fluent flux sum and CFD post flux sum both agree with the total mass flow. But in other cases I've seen CFD post sum exceeds the total mass flow.
-
November 2, 2023 at 5:23 pm
Rob
Forum ModeratorIt means they'll generally miss (or get stuck in) recirculation zones. It also means if you release from the inlet and have (for example) 20 that there's a very good chance they'll not be very representative of a complex flow. There's a reason we may use pathlines, vectors and contours, and not everything every time.
CFD Post is uses an interpolated data set from Fluent - it's covered somewhere in the manuals. For a well resolved flowfield (ie lots of mesh where the flow gets interesting) the difference is negligable. Fluent's data is exactly what the solver calculates so I always use that, even when I did (rarely) use CFD Post.
-
November 2, 2023 at 8:59 pm
wen_liu
SubscriberThanks for the detailed explanations. My case is usually very slow flow through a very tight space, and involves porous zone as part of fluid region. So just to check if my understanding is correct: is the case too complex to be accurately reflected in a streamline, so streamline could even show a trend that is opposite to the real results?
And since the flow rate is very slow, flux distributed on each surface is even lower; so the interpolation of data from Fluent to CFD post could cause some inaccuracy in results?
-
-
November 3, 2023 at 2:37 pm
Rob
Forum ModeratorNot too complex, you may just not have enough pathlines in the right place to see what's happening. CFD is fairly easy to set up, doing it well and then working out what it's telling you takes more practice.
Interpolation from Fluent to CFD Post can give an error. Mesh resolution improvements reduce this, but we always recommend taking numerical data from Fluent; in previous versions CFD Post gave better quality images but that's not really the case in more recent versions.
-
- The topic ‘Fluent Post Processing: use radial velocity component to represent flow rate?’ is closed to new replies.


-
4643
-
1540
-
1386
-
1230
-
1021

© 2025 Copyright ANSYS, Inc. All rights reserved.


