-
-
October 11, 2018 at 11:54 pm
ahmadzaki
SubscriberHello,
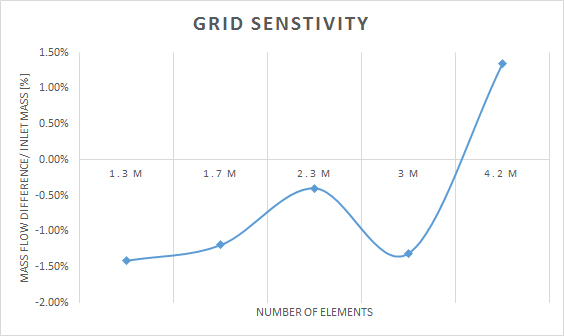
I've been conducting a grid sensitivity analysis for an opened building inside a domain. I took five different grids, all structured, the meshing order was the same for all of them (meshing steps), and the reduction percentage was the same. However, the analysis didn't give a decreasing/ increasing behaviour it looked as shown; the mass flow rate percentage difference across the building relative to the inlet mass flow rate was compared for each case. which are the accurate ones? and why it is behaving like this?
Thank you
Ahmad
-
October 12, 2018 at 12:44 am
klu
Ansys EmployeeHi Ahmad,
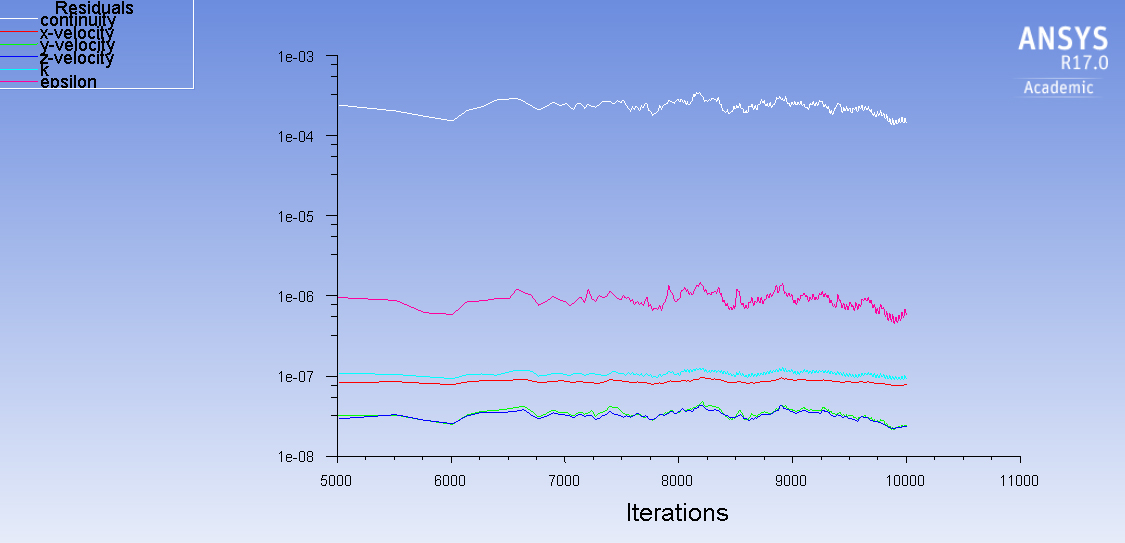
Can you please replace the X axis with the cell numbers? Also would you please show us the convergence for each mesh case?
-
October 12, 2018 at 3:22 am
-
October 12, 2018 at 2:27 pm
Rob
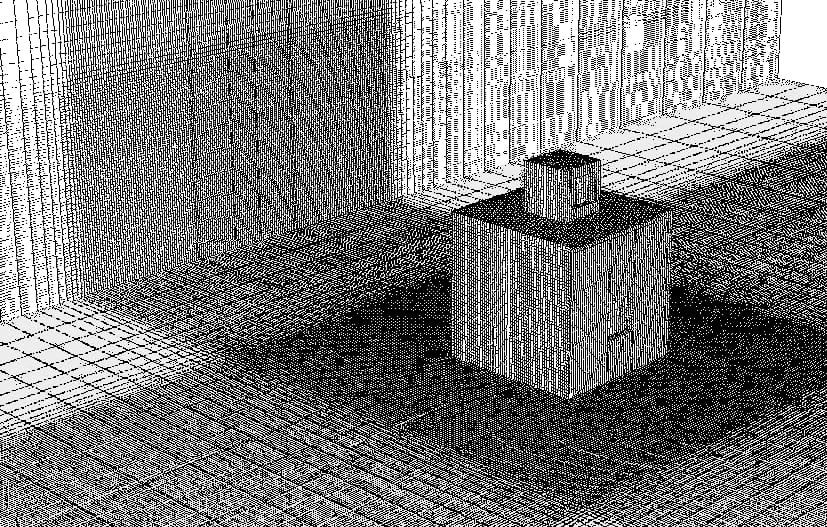
Forum ModeratorPlease can you post images of the domain and residuals. Whole building models rarely show convergence at 10^-6 as there is nearly always flow separation somewhere in the domain and/or interacting jets because of the scale.
-
October 12, 2018 at 8:42 pm
-
October 12, 2018 at 9:58 pm
Karthik Remella
AdministratorHello,
Couple of thoughts:
- What kind of model are you running - K-epsilon: enhanced wall treatment or wall functions, and what are your y+ values?
- Do you have any monitors and have they become steady? Generally, it is always a good practice to create as many monitors as possible when performing grid independence studies. If it likely that your residuals are flat, but your monitors are oscillating and therefore, you are seeing different results. Please make sure you have reached true steady state solution by using appropriate monitors.
I hope this helps.
Best Regards,
Karthik
-
October 13, 2018 at 5:02 am
ahmadzaki
SubscriberHello Karthik,
I'm using K_epsilon, with default wall functions.
and yes, I had velocity monitors and they became steady (levelled up into a straight line).
thank you
-
October 15, 2018 at 2:43 pm
Rob
Forum ModeratorI think the finer mesh is picking up some transient eddy shedding on the building. Can you plot contours of pressure on the sides of the building and take an image every 10 iterations for a few hundred iterations? I'd use the execute commands feature to do this: doing it manually will be tedious!
For a built environment model I usually reckon on a high imbalance due to these effects, and switching to transient isn't practical.
-
- The topic ‘Strange grid senstivity behaviour’ is closed to new replies.


-
5049
-
1759
-
1387
-
1248
-
1021

© 2026 Copyright ANSYS, Inc. All rights reserved.


