-
-
August 28, 2023 at 1:28 pm
Marin Milovac
SubscriberHello,
I tried to simulate a regular 50-ohm line with 35-ohm discontinuity in the middle of the transmission line using SIWave as can be seen in the picture below: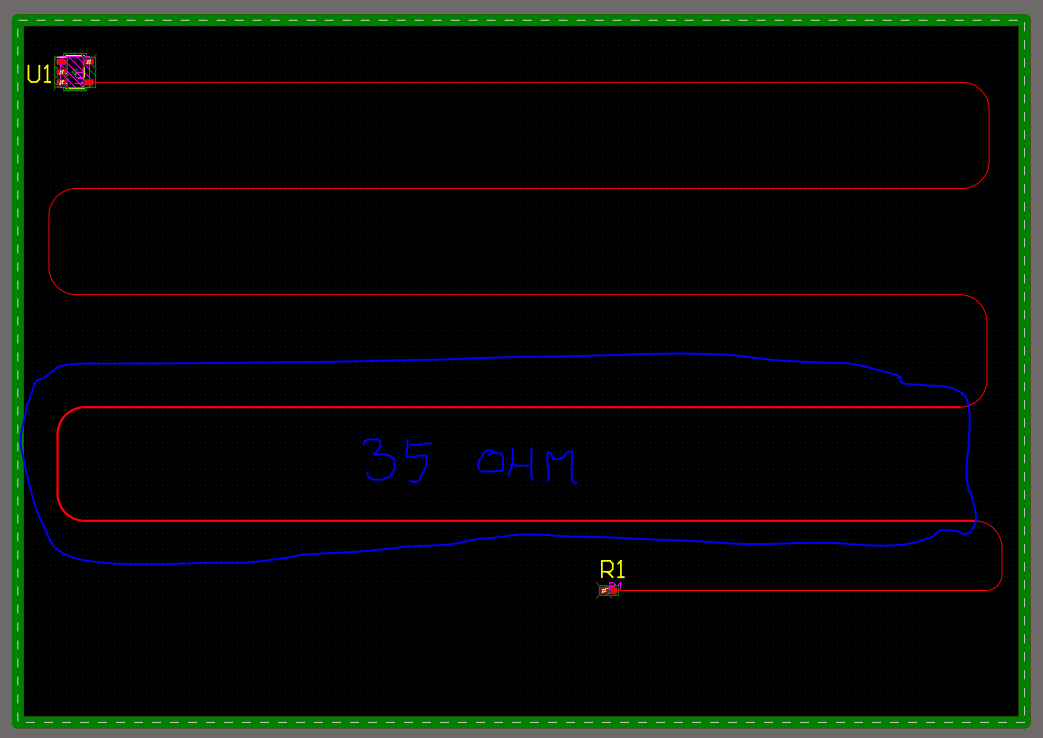
I also simulated it using LTspice: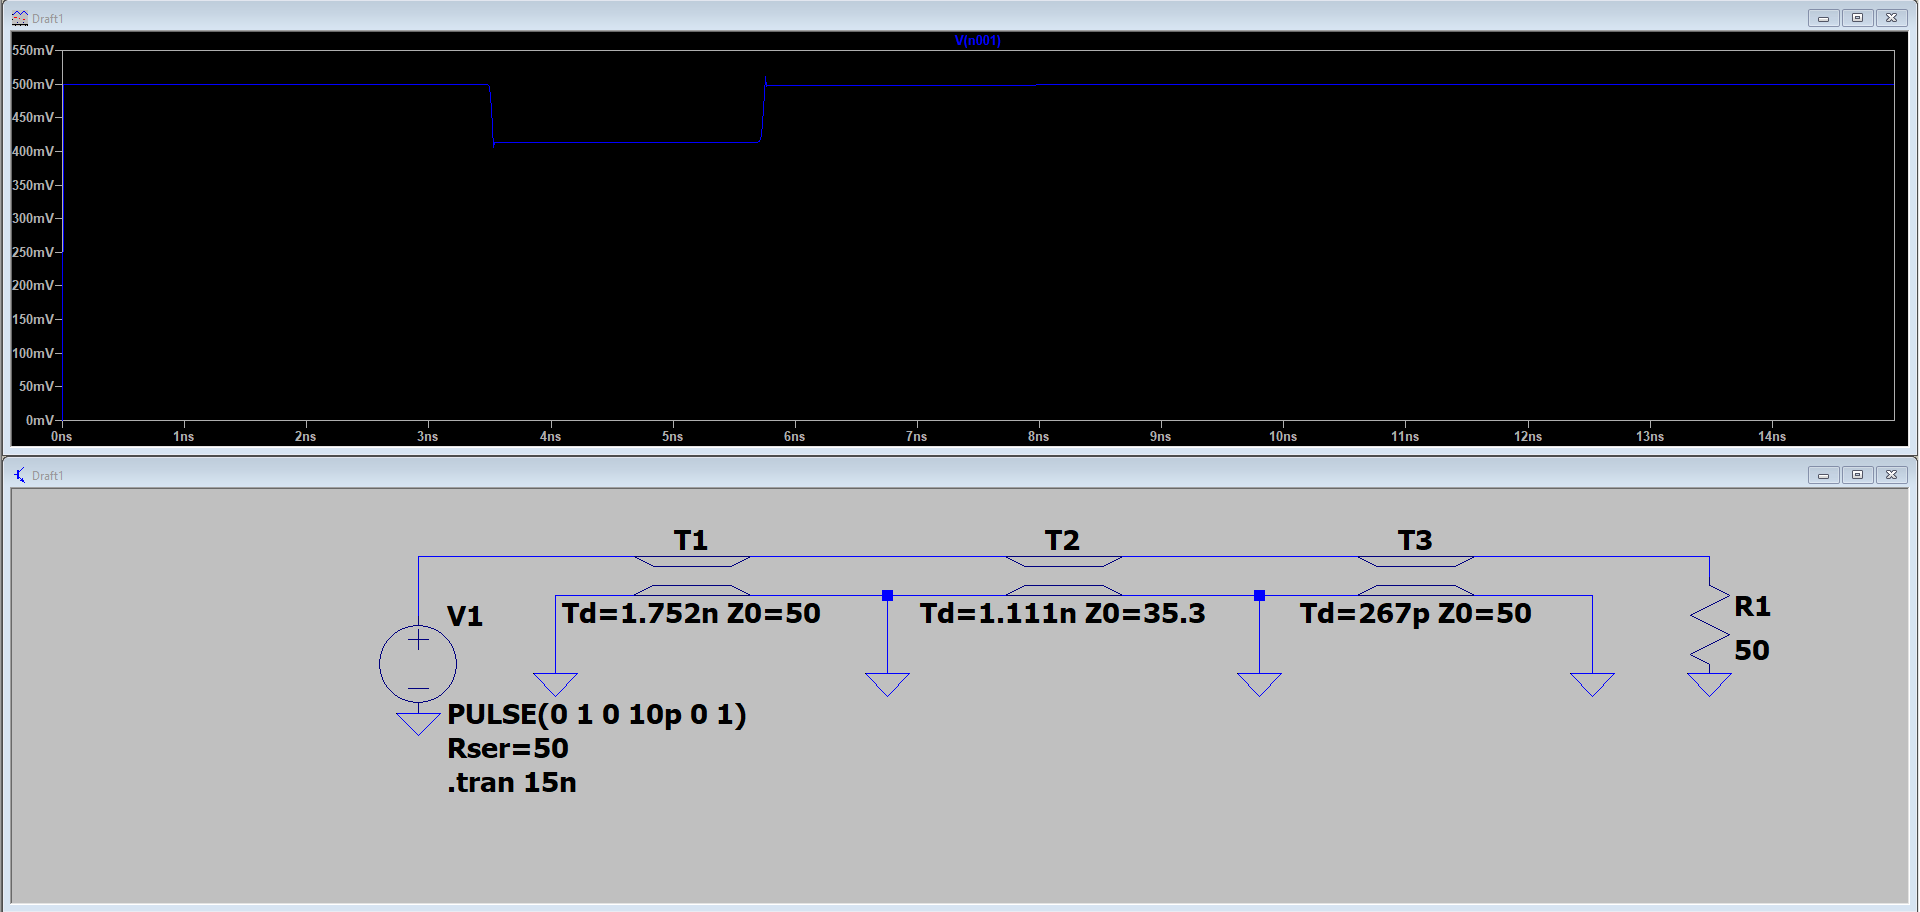
The blue line in the picture above shows the voltage at the + terminal of the V1 voltage source. Looking at the line we can clearly see where 35 ohm voltage discontinuity is. We can also see in the discontinuity that the voltage rises and falls in 10ps (equal to the rise time of the voltage source) and lasts 2 times the length of the discontinuity (~2.222nS).
When I try to simulate the exact same thing via TDR in the SIwave I get this result: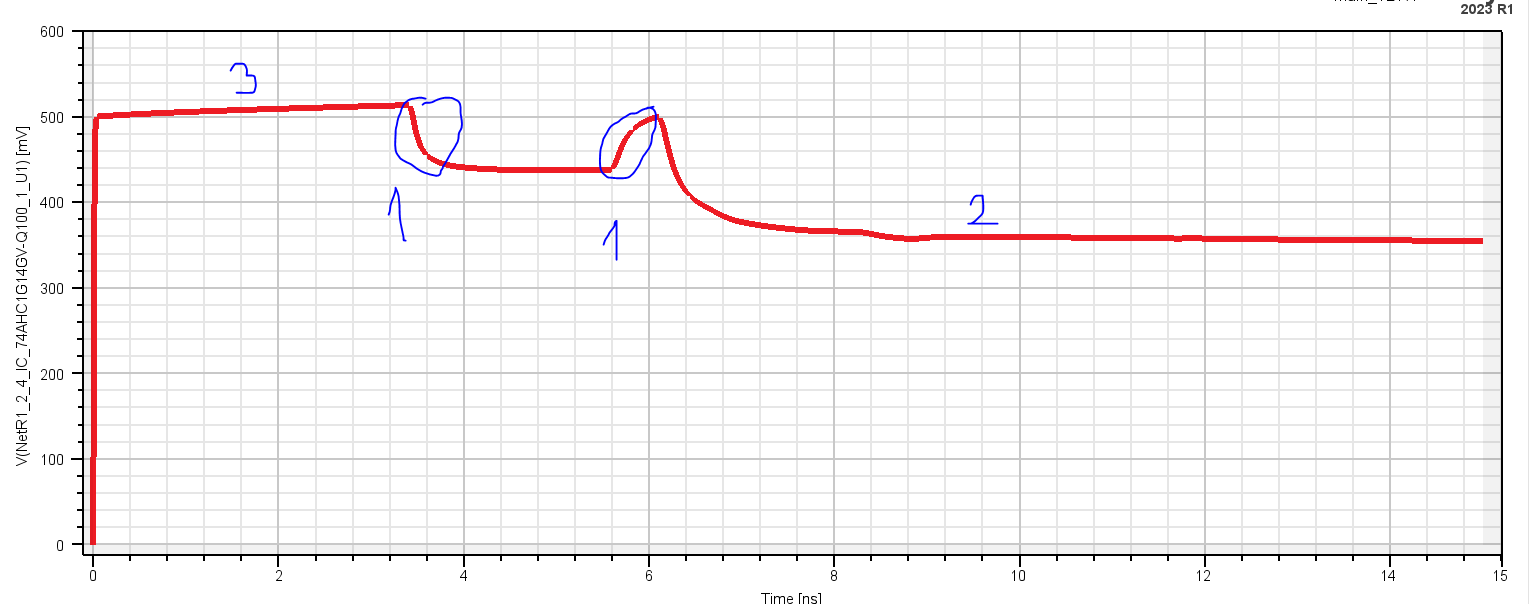
My questions are:
1. Why is the fall/rise time of the signal in the discontinuity so low? Shouldn't it fall/rise in 10pS? From what I see here it takes ~200pS.
2. Why does the signal fall to around 350mV, shouldn't it rise back to ~500mV?
3. Why is there a "ramp" at the beginning of the propagation?
Here are the parameters that I used: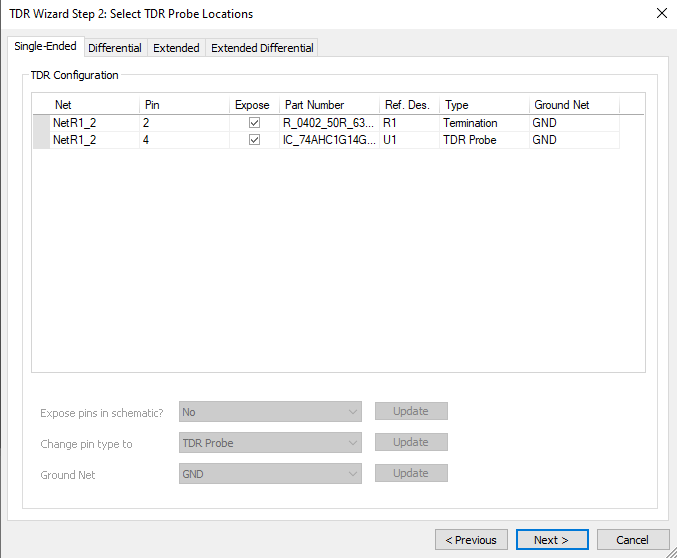
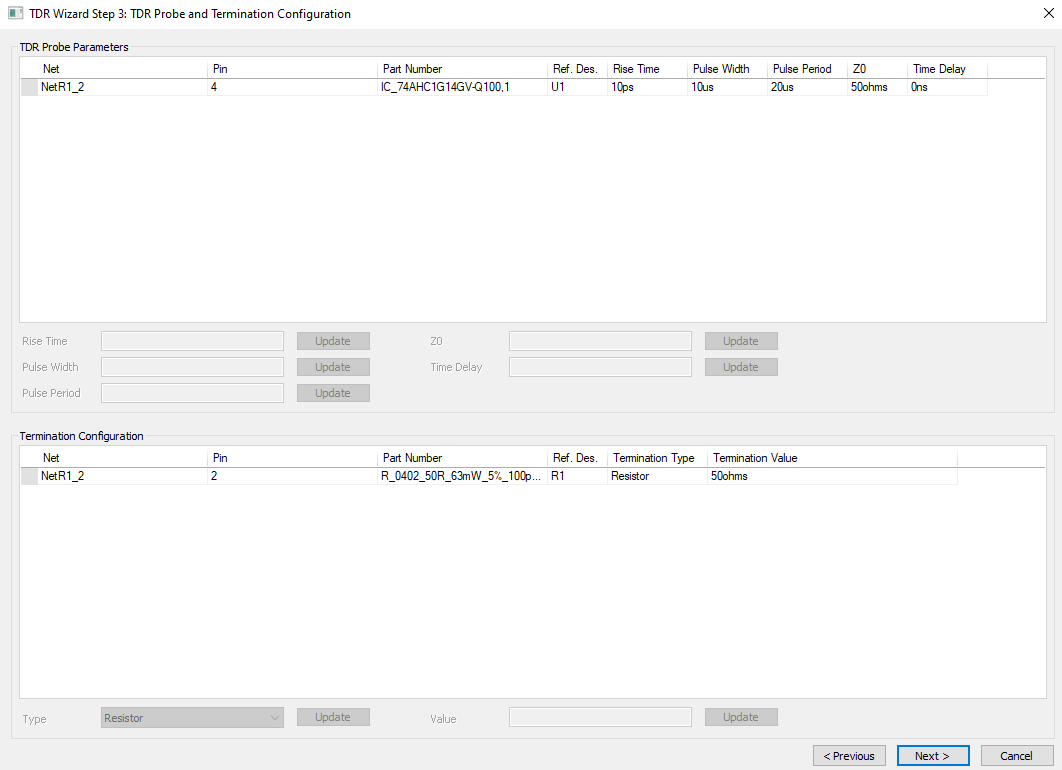
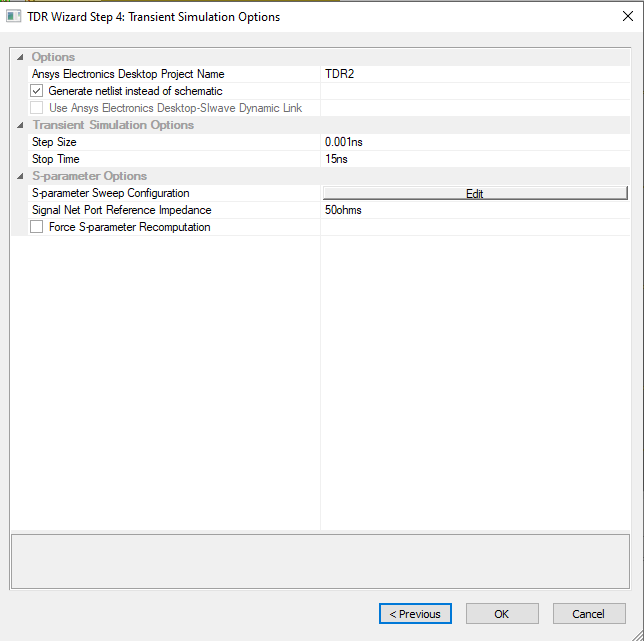
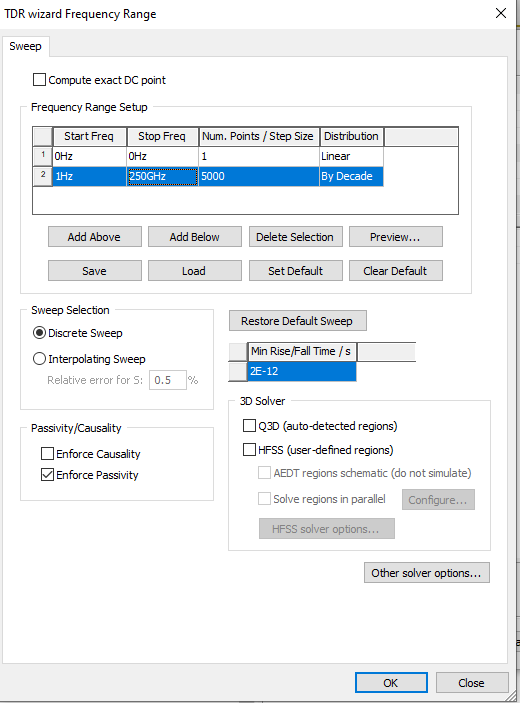
Thank you in advance,
Marin -
August 29, 2023 at 11:42 am
Sriparna
Ansys EmployeeHi Marin,
I have gone through the setup and your questions. It's difficult to answer them without looking into the model in SIwave.
If you have access to Ansys Support , please log a support case in this portal https://customer.ansys.com
Our support Engineer will get in with you for one to one support.
-
- The topic ‘Questions regarding impedance discontinuity of TDR simulation results’ is closed to new replies.


- HFSS Incident Plane Wave excitement mode
- Simulation of capacitor combining eddy currents with displacement currents
- How to calculate eddy and hysteresis losses of the core?
- Ansys Maxwell 3D – eddy current
- How to determine initial position in motion setup
- dq graph non-conformity
- Simplorer+Maxwell Cosimulation results and Maxwell results mismatch
- Parametrizing coil “terminals” with coil geometry
- On-chip inductor design
- Maxwell circuit – PWM

-
1416
-
599
-
591
-
565
-
366

© 2025 Copyright ANSYS, Inc. All rights reserved.


