Ansys Assistant will be unavailable on the Learning Forum starting January 30. An upgraded version is coming soon. We apologize for any inconvenience and appreciate your patience. Stay tuned for updates.
Photonics

Photonics

Topics related to Lumerical and more.

Problem in plotting the E field

    • xuanlunhuang20
      Subscriber

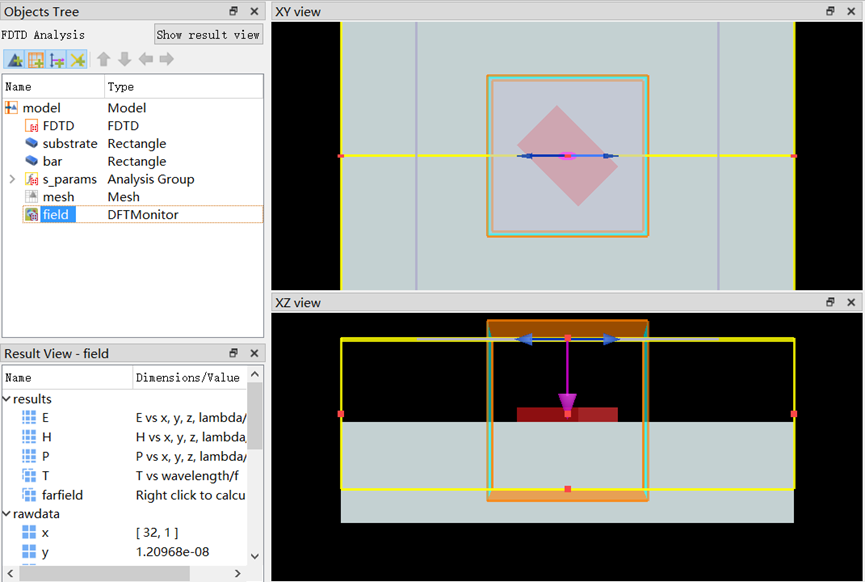
      I’m simulating a meta-structure and I add a field monitor to view the E field. But I find that the x component in E and the Ex data are different.


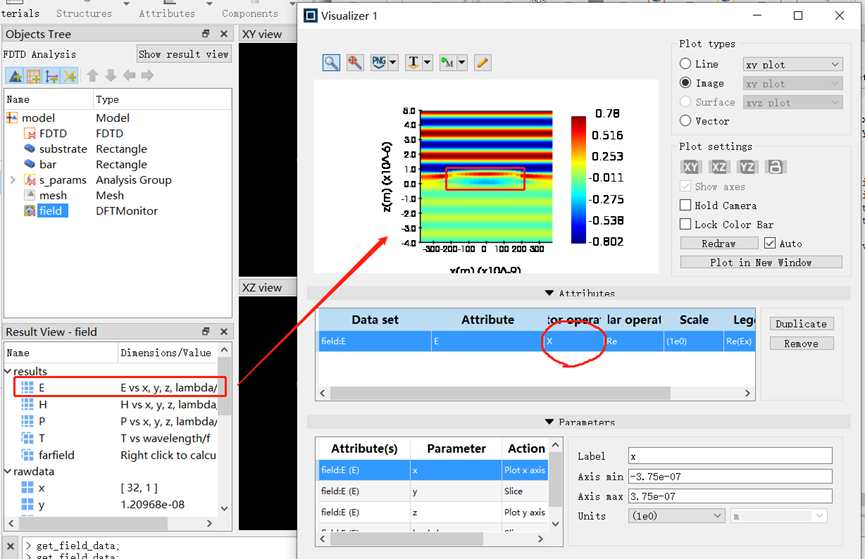
      I right click the E and show the x component, it looks like this:


      I right click the Ex data and it looks like this:


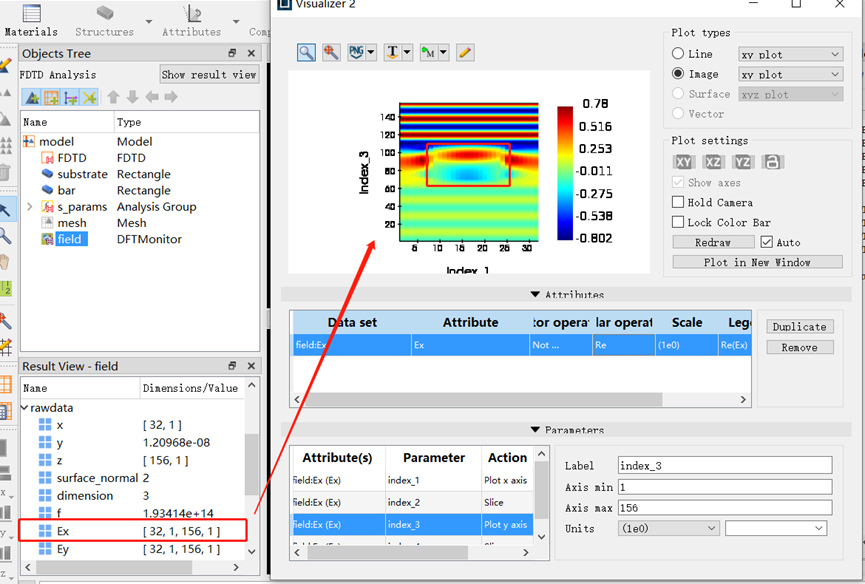
      It can be seen that the scales of these two results are different. So, when I plot Ex with the x and z, it is not correct. Even though I save the whole E result and plot the first column, i.e., Ex, it appears like the second case.


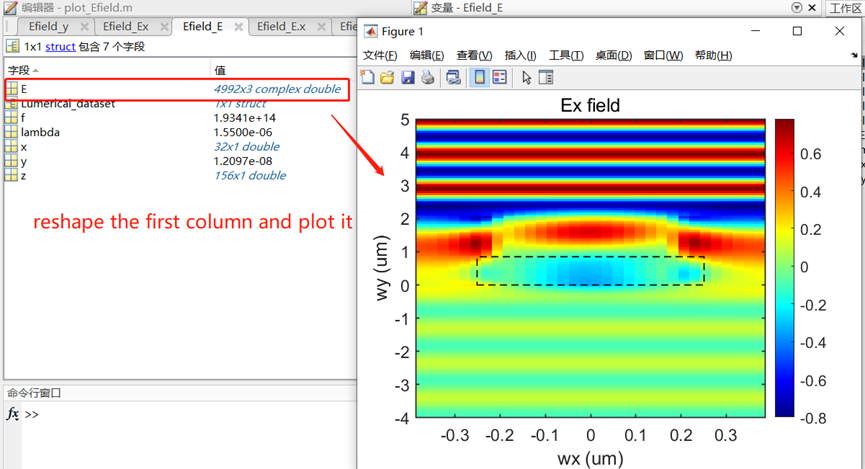
      But the correct one I think should be the first case. Why does this happen and how to solve this? Thanks.

    • Niki Papachristou
      Forum Moderator

      Hi Xuanlun Huang,

      Thank you for you post at our forum. I see that in one case you are plotting the simulated E data while in the other case you are getting the index numbers, hence his plot in this case looks a little bit stretched. You should note that neither plots (as is) show the true dimensions of the structure. For example in the second plot the x span and y span of the plot are similar in length, but in reality it's ~0.6um vs 10um... and if you change the size of the window the results appearance change as well. However, I agree that first plot is preferable, since it corresponds to length, while the second format is corresponding to the number of points and loses this information.

      Kind Regards,

      Niki

Viewing 1 reply thread
  • The topic ‘Problem in plotting the E field’ is closed to new replies.
[bingo_chatbox]