Hi All. I am simulating a simple setup consisting of 2 parallel copper plates, separated by a distance d. I will be using the plates in application of capacitive wireless power transfer, so its dimensions are large.
Length = 0.6m , Width = 0.275m , Thickness = 0.5mm, Air-gap distance d = 0.12m
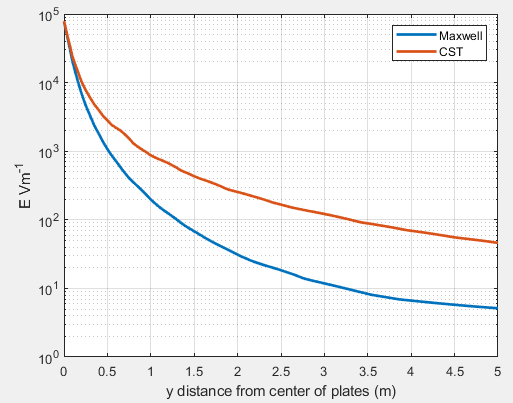
However, I see discrepancies when I compared measured E-field values on Ansys (both from Maxwell and HFSS) with CST. Excitation voltage is 12kV for Maxwell electrostatics and 12kV peak for sinusoidal sources in HFSS.
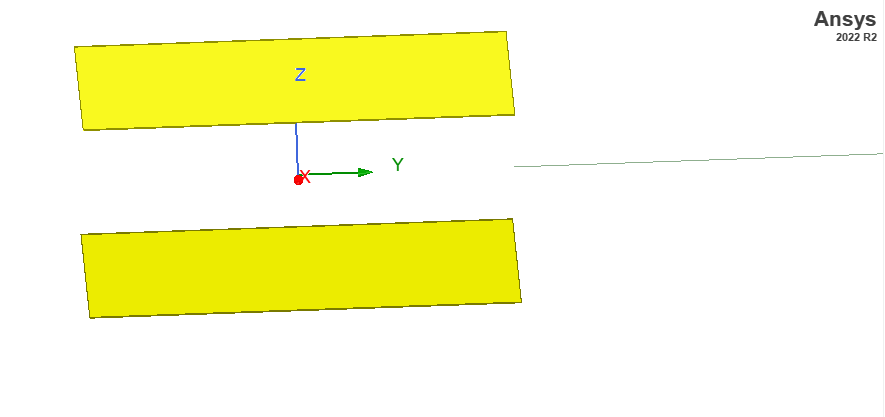
As seen from this setup picture, I am measuring the E-field along the entire line (in green, along y-axis). Here is a comparison of the discrepancy found between Ansys & CST data:
I wanted to ask of the possible reasons for this discrepancy. I have tried making the mesh very fine, increased the minimum number of passes, and made the convergence criteria very strict. Still, I observe such a difference in E-field values when comparing both the softwares.
Note: Simulations were done not only using electrostatics in Maxwell but also multiple frequencies in HFSS. Both HFSS & Maxwell pretty much give the same E-field values but they are different from what I obtain in CST.


