TAGGED: batch-mode, cores, mpi, output-file, parallel-processing
-
-
May 19, 2022 at 5:29 am
cviveknair
Subscriber
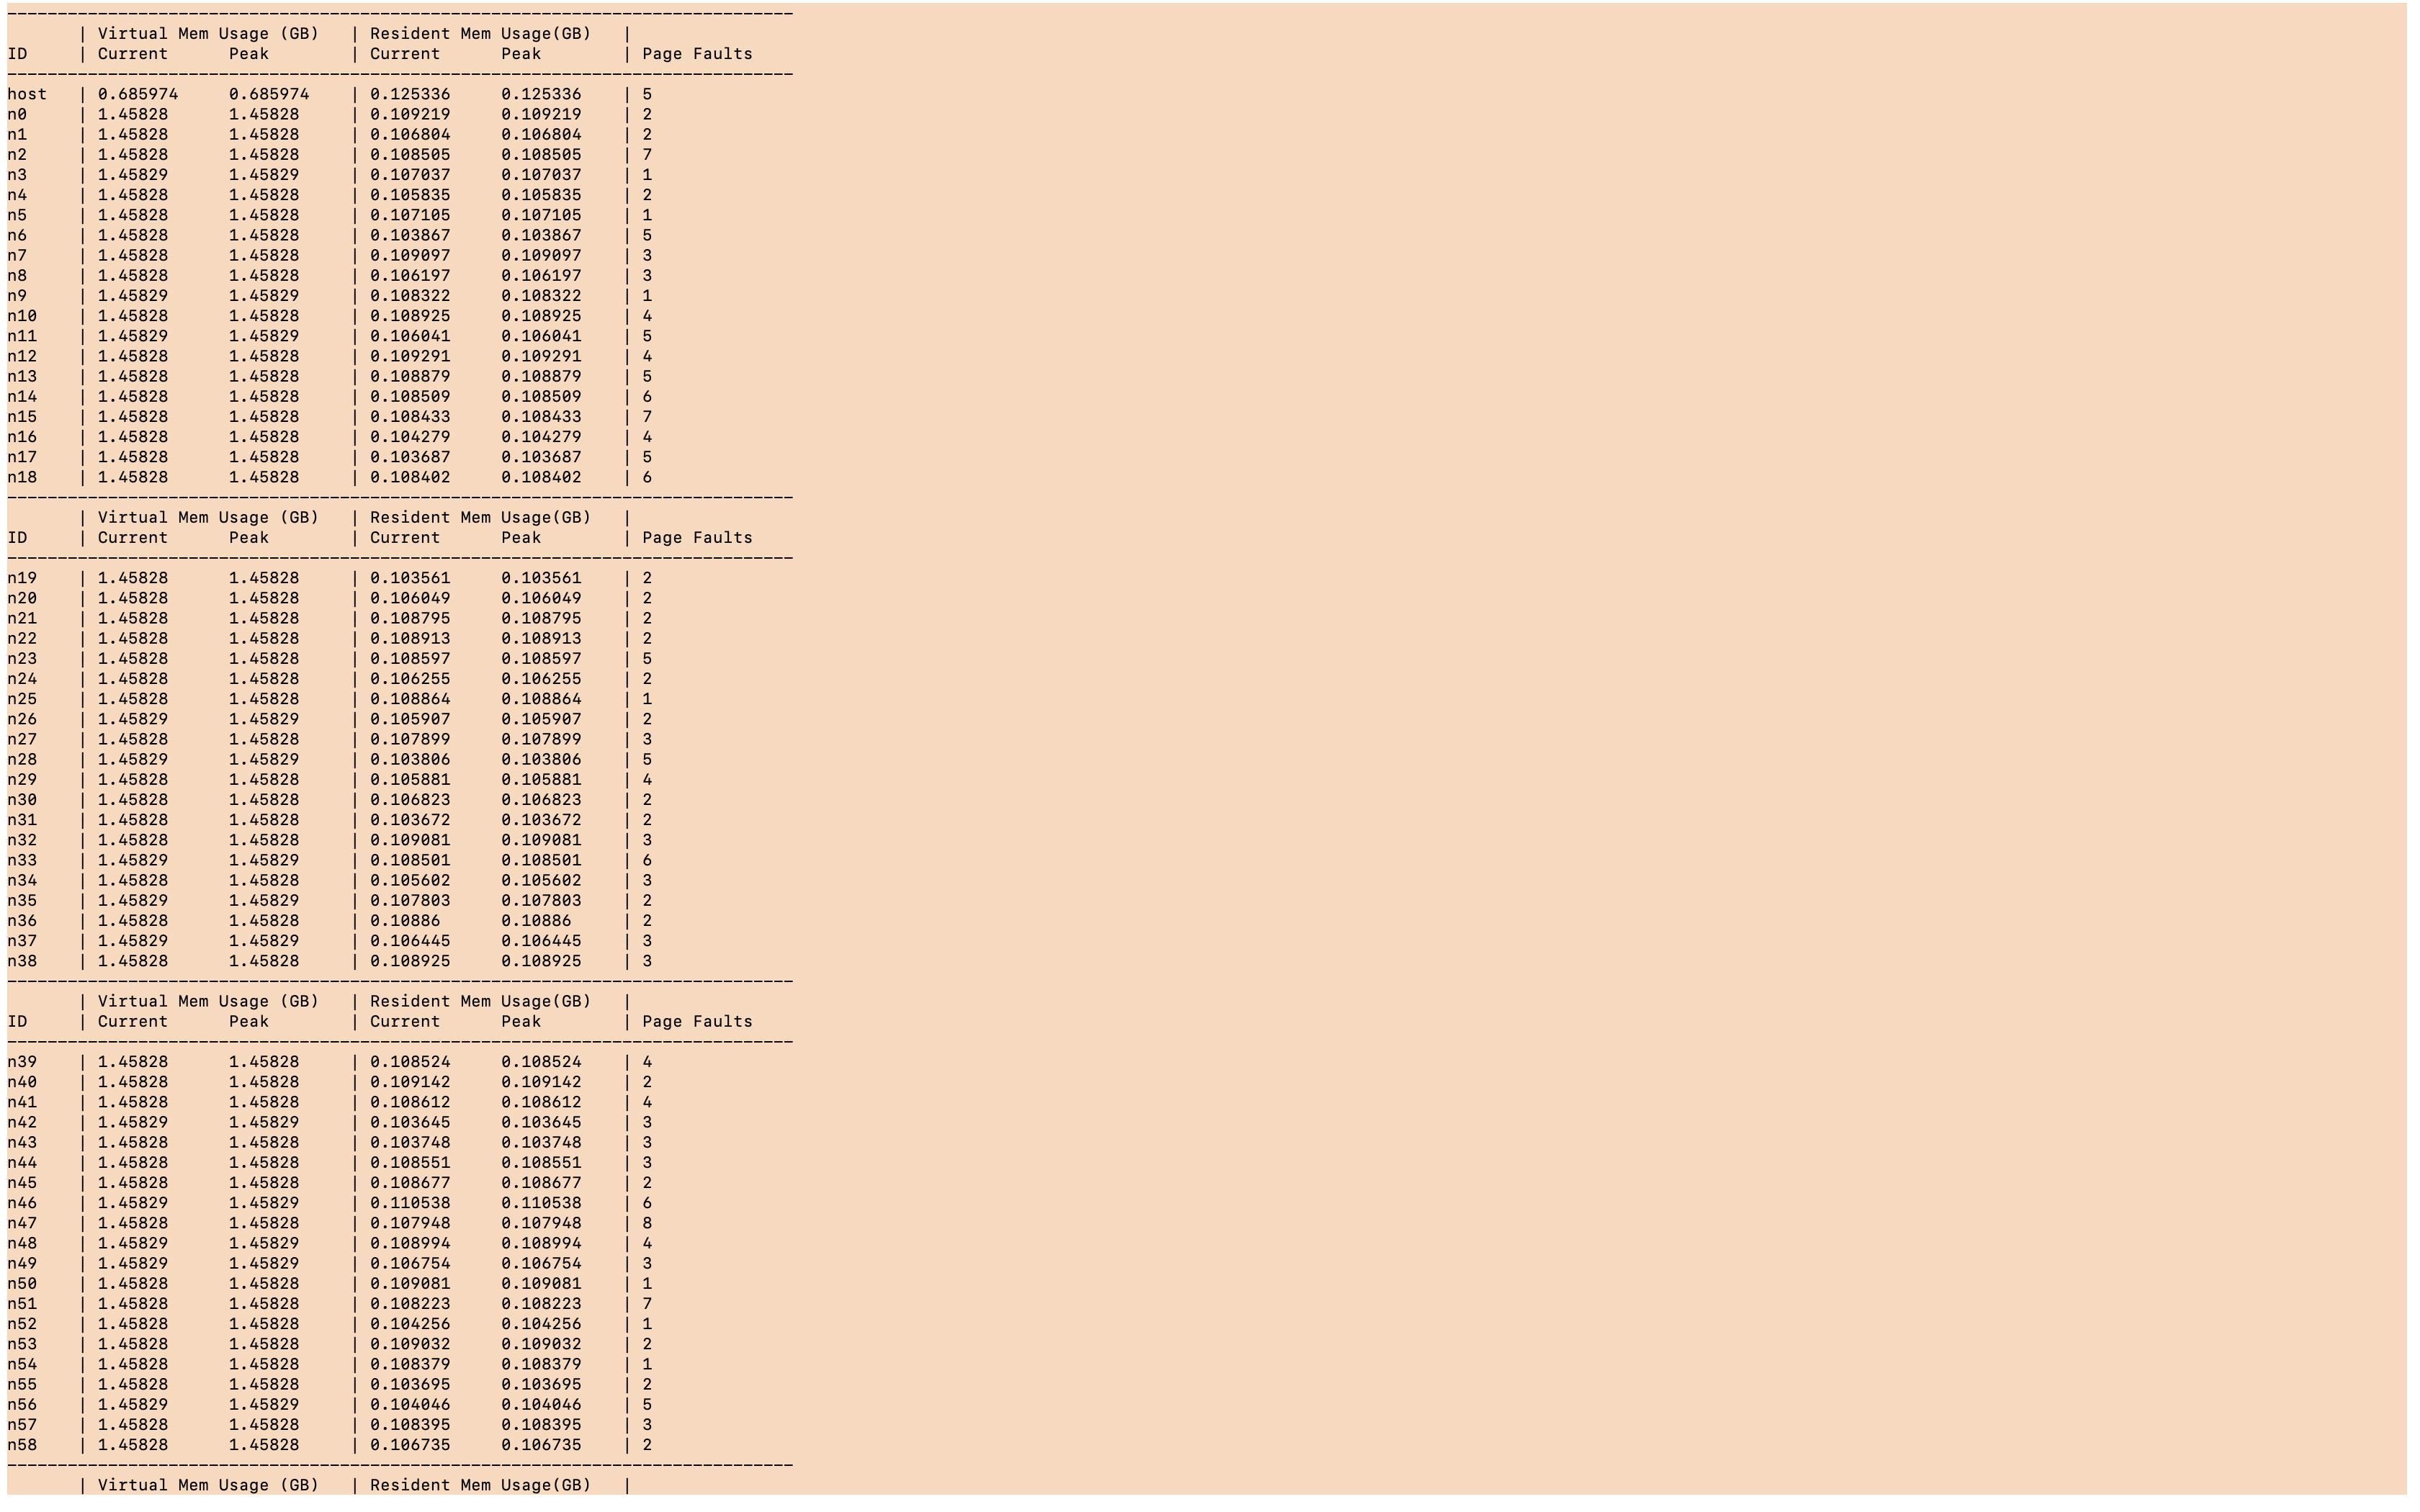
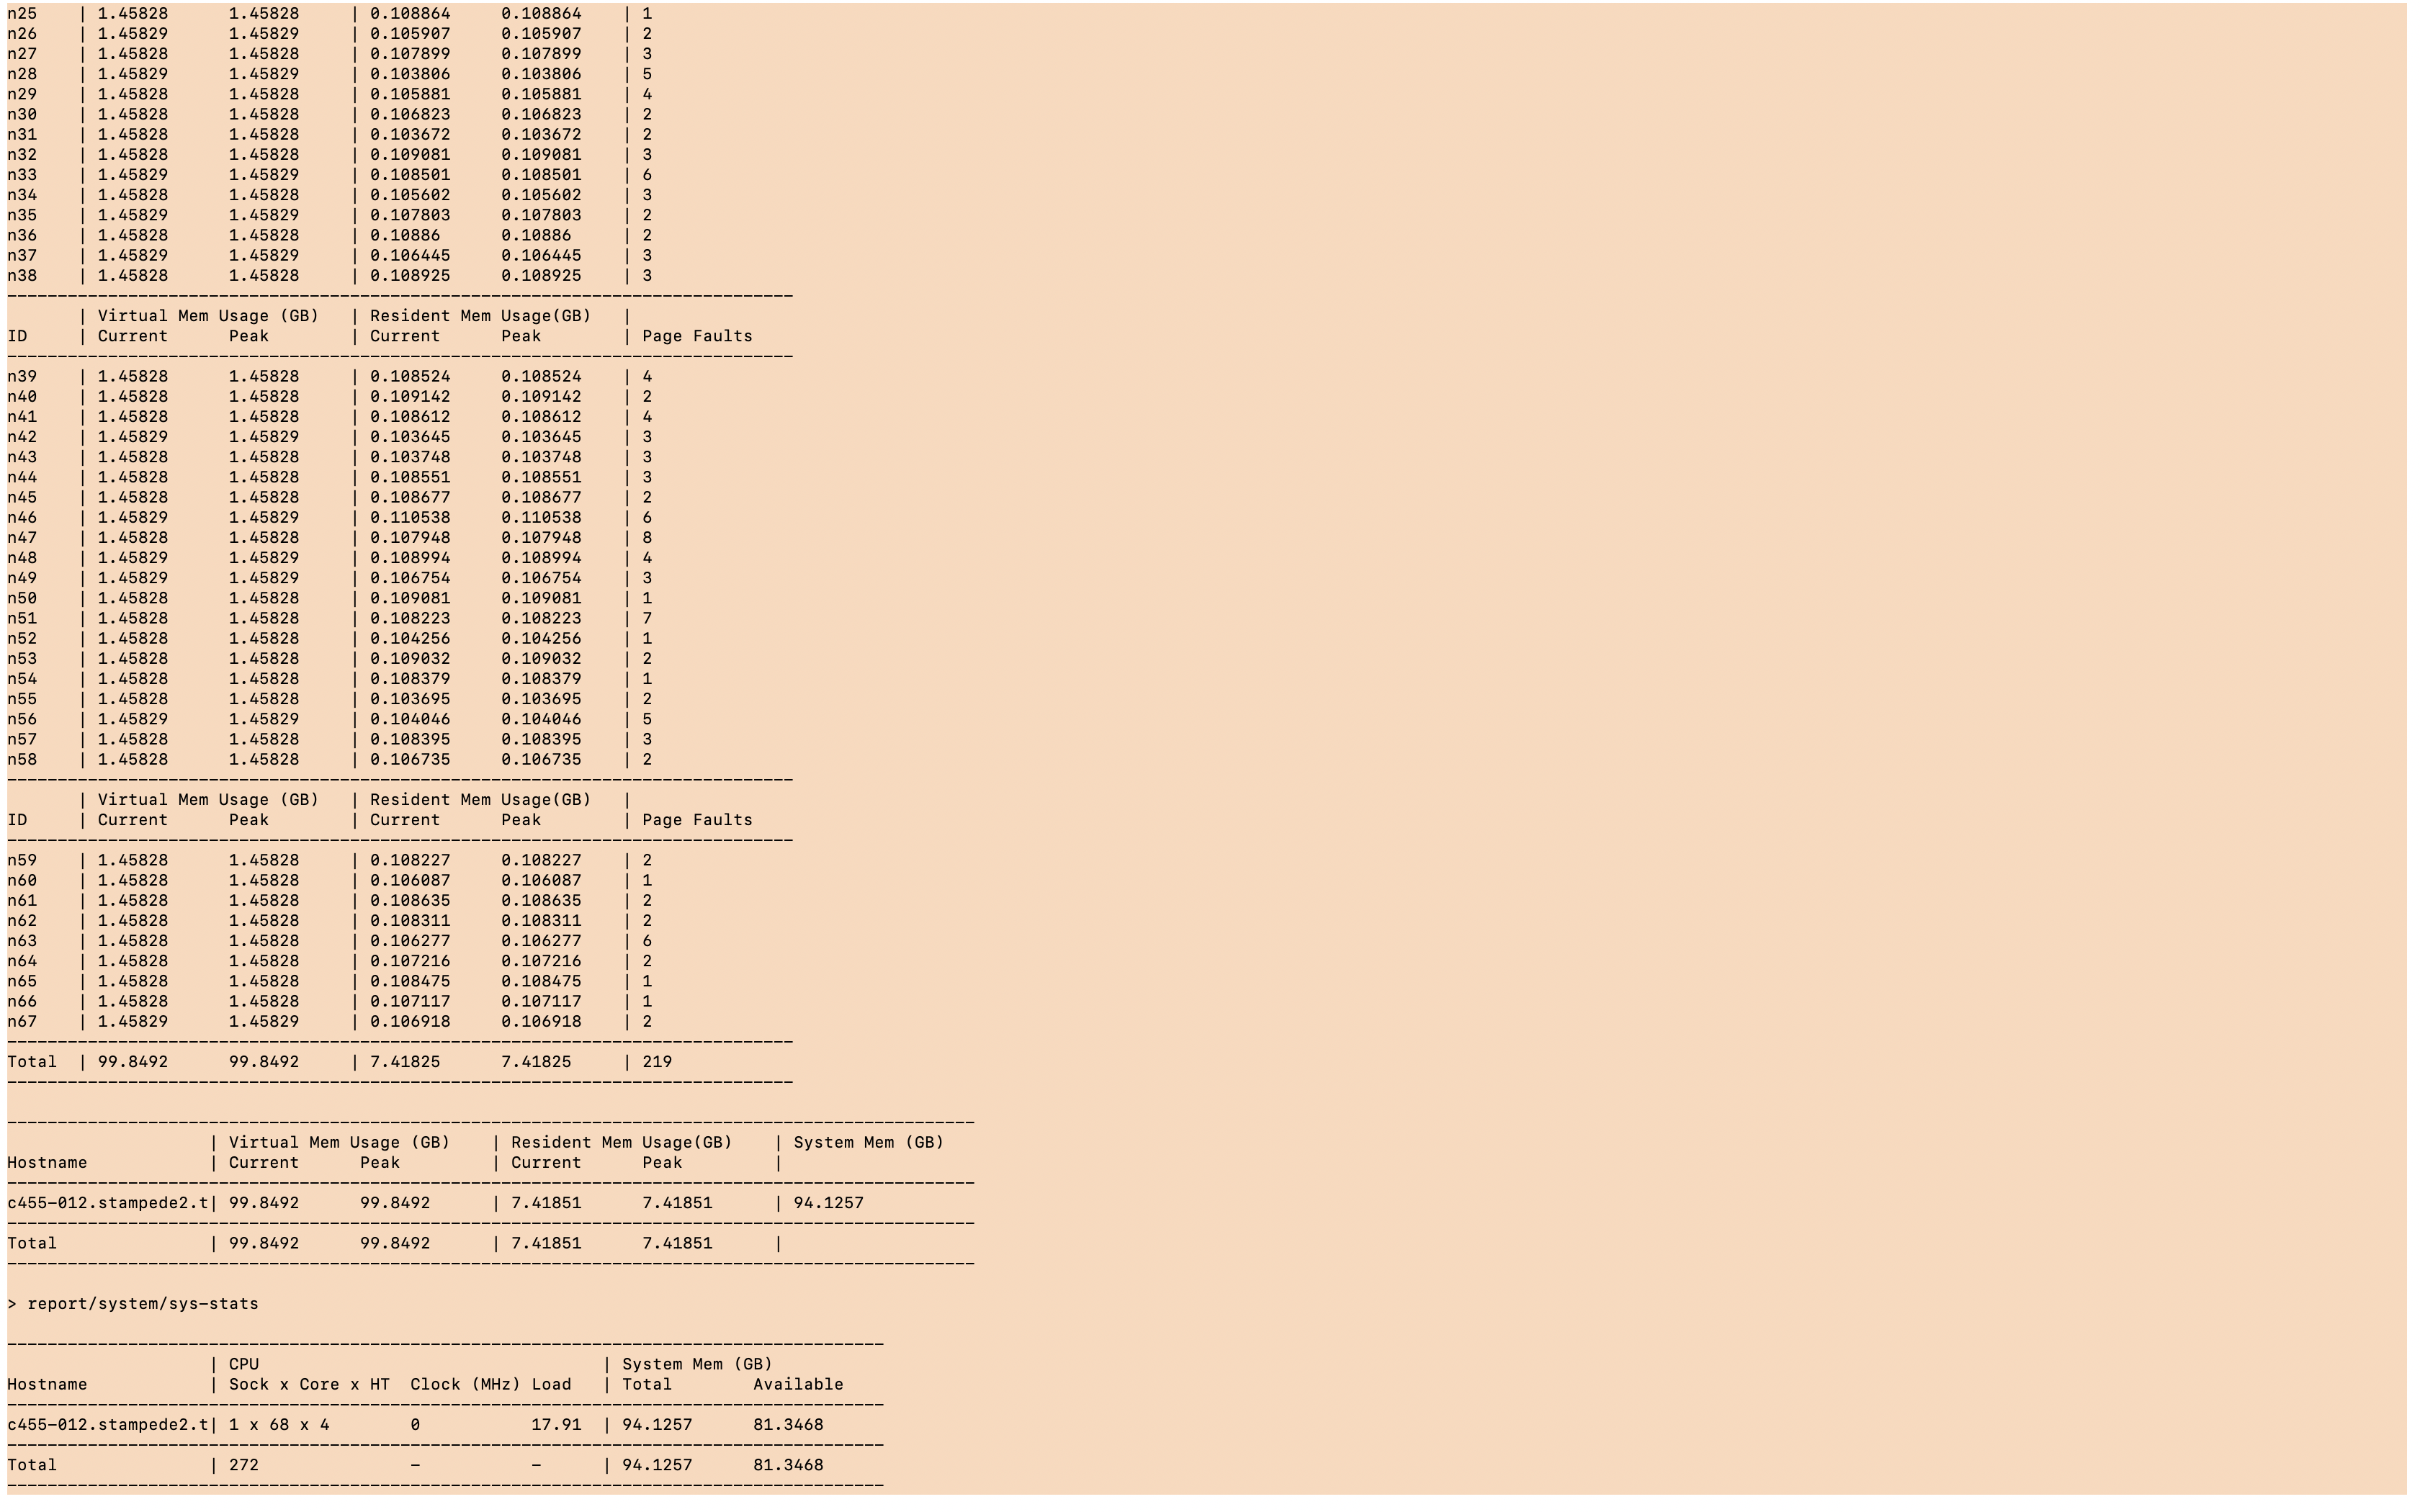
Running fluent on a large cluster results in the following outfile section with The ID hostname Core PID etc..
------------------------------------------------------------------------------------------
ID   Hostname      Core  O.S.   PID      Vendor
------------------------------------------------------------------------------------------
n0-67 c455-051.xx.t 68/272 Linux-64 151468-151535 Intel(R) Xeon Phi(TM) 7250
host  c455-051xx.t     Linux-64 148637     Intel(R) Xeon Phi(TM) 7250
MPI Option Selected: intel
Selected system interconnect: mpi-auto-selected
------------------------------------------------------------------------------------------
I am used to seeing this section in the following way:
#example parallelization 16 cores:Â
ID Hostname Core OS PID VendorÂ
n##. XX. 1/16 X. ##. XXÂ
n##. XX. 2/16 X. ##. XXÂ
n##. XX. 3/16 X. ##. XXÂ
n##. XX. 4/16 X. ##. XXÂ
and so on...
While the ID n0-67 and the PID 151468-151535 point to 68 parallel subprocesses being created (as requested) It seems like they are all assigned to a single node 68/272. Is this an incorrect assumption on my part and is the process actually being divided across 68 cores are well ?
Any help would be appreciated. Thank you.
May 19, 2022 at 8:27 pmDrAmine
Ansys EmployeeHow are you starting (command) and how many cores do exist on each node? Also print the proc and sys stats in Fluent.
May 19, 2022 at 10:02 pmcviveknair
SubscriberHello Dr. Amine An error on my part in the original question- "It seems like they are all assigned to a single node 68/272." I meant to say It seems like they are all assigned to a single CORE 68/272.
each node has 68 cores with 4 threads each and In the run that produced the out file I am assigning the subprocess to run across 68 cores all within a single node only.
The job scheduler is SLURM and this is the command used to start fluent within the script submitted for the job.
#SBATCH -N 1# number of nodes
#SBATCH -n 68#number of cores
.
.
module load Ansys
MYFILEHOSTS="hostlist.$SLURM_JOB_ID"
srun hostname | sort > $MYFILEHOSTS
# Run ANSYS Job
"/home1/apps/ANSYS/2021R2/v212/fluent/bin/fluent" 3ddp -g -ssh -t$SLURM_NTASKS -mpi=intel -cnf=$MYFILEHOSTS -i myinpfile.inp
May 19, 2022 at 10:06 pmMay 20, 2022 at 9:54 amcviveknair
SubscriberHello Dr. Amine An error on my part in the original question- "It seems like they are all assigned to a single node 68/272." I meant to say It seems like they are all assigned to a single CORE 68/272.
each node has 68 cores with 4 threads each and In the run that produced the out file I am assigning the subprocess to run across 68 cores all within a single node only.
The job scheduler is SLURM and this is the command used to start fluent within the script submitted for the job.
#SBATCH -N 1# number of nodes
#SBATCH -n 68#number of cores
.
.
module load Ansys
MYFILEHOSTS="hostlist.$SLURM_JOB_ID"
srun hostname | sort > $MYFILEHOSTS
# Run ANSYS Job
"/home1/apps/ANSYS/2021R2/v212/fluent/bin/fluent" 3ddp -g -ssh -t$SLURM_NTASKS -mpi=intel -cnf=$MYFILEHOSTS -i myinpfile.inp
PROC-STATS:
------------------------------------------------------------------------------
| Virtual Mem Usage (GB) | Resident Mem Usage(GB) |
ID | CurrentPeak| CurrentPeak| Page Faults
------------------------------------------------------------------------------
host | 0.685974 0.685974| 0.125336 0.125336| 5
n0 | 1.458281.45828 | 0.109219 0.109219| 2
n1 | 1.458281.45828 | 0.106804 0.106804| 2
n2 | 1.458281.45828 | 0.108505 0.108505| 7
n3 | 1.458291.45829 | 0.107037 0.107037| 1
n4 | 1.458281.45828 | 0.105835 0.105835| 2
n5 | 1.458281.45828 | 0.107105 0.107105| 1
n6 | 1.458281.45828 | 0.103867 0.103867| 5
n7 | 1.458281.45828 | 0.109097 0.109097| 3
n8 | 1.458281.45828 | 0.106197 0.106197| 3
n9 | 1.458291.45829 | 0.108322 0.108322| 1
n10| 1.458281.45828 | 0.108925 0.108925| 4
n11| 1.458291.45829 | 0.106041 0.106041| 5
n12| 1.458281.45828 | 0.109291 0.109291| 4
n13| 1.458281.45828 | 0.108879 0.108879| 5
n14| 1.458281.45828 | 0.108509 0.108509| 6
n15| 1.458281.45828 | 0.108433 0.108433| 7
n16| 1.458281.45828 | 0.104279 0.104279| 4
n17| 1.458281.45828 | 0.103687 0.103687| 5
n18| 1.458281.45828 | 0.108402 0.108402| 6
------------------------------------------------------------------------------
| Virtual Mem Usage (GB) | Resident Mem Usage(GB) |
ID | CurrentPeak| CurrentPeak| Page Faults
------------------------------------------------------------------------------
n19| 1.458281.45828 | 0.103561 0.103561| 2
n20| 1.458281.45828 | 0.106049 0.106049| 2
n21| 1.458281.45828 | 0.108795 0.108795| 2
n22| 1.458281.45828 | 0.108913 0.108913| 2
n23| 1.458281.45828 | 0.108597 0.108597| 5
n24| 1.458281.45828 | 0.106255 0.106255| 2
n25| 1.458281.45828 | 0.108864 0.108864| 1
n26| 1.458291.45829 | 0.105907 0.105907| 2
n27| 1.458281.45828 | 0.107899 0.107899| 3
n28| 1.458291.45829 | 0.103806 0.103806| 5
n29| 1.458281.45828 | 0.105881 0.105881| 4
n30| 1.458281.45828 | 0.106823 0.106823| 2
n31| 1.458281.45828 | 0.103672 0.103672| 2
n32| 1.458281.45828 | 0.109081 0.109081| 3
n33| 1.458291.45829 | 0.108501 0.108501| 6
n34| 1.458281.45828 | 0.105602 0.105602| 3
n35| 1.458291.45829 | 0.107803 0.107803| 2
n36| 1.458281.45828 | 0.108860.10886 | 2
n37| 1.458291.45829 | 0.106445 0.106445| 3
n38| 1.458281.45828 | 0.108925 0.108925| 3
------------------------------------------------------------------------------
| Virtual Mem Usage (GB) | Resident Mem Usage(GB) |
ID | CurrentPeak| CurrentPeak| Page Faults
------------------------------------------------------------------------------
n39| 1.458281.45828 | 0.108524 0.108524| 4
n40| 1.458281.45828 | 0.109142 0.109142| 2
n41| 1.458281.45828 | 0.108612 0.108612| 4
n42| 1.458291.45829 | 0.103645 0.103645| 3
n43| 1.458281.45828 | 0.103748 0.103748| 3
n44| 1.458281.45828 | 0.108551 0.108551| 3
n45| 1.458281.45828 | 0.108677 0.108677| 2
n46| 1.458291.45829 | 0.110538 0.110538| 6
n47| 1.458281.45828 | 0.107948 0.107948| 8
n48| 1.458291.45829 | 0.108994 0.108994| 4
n49| 1.458291.45829 | 0.106754 0.106754| 3
n50| 1.458281.45828 | 0.109081 0.109081| 1
n51| 1.458281.45828 | 0.108223 0.108223| 7
n52| 1.458281.45828 | 0.104256 0.104256| 1
n53| 1.458281.45828 | 0.109032 0.109032| 2
n54| 1.458281.45828 | 0.108379 0.108379| 1
n55| 1.458281.45828 | 0.103695 0.103695| 2
n56| 1.458291.45829 | 0.104046 0.104046| 5
n57| 1.458281.45828 | 0.108395 0.108395| 3
n58| 1.458281.45828 | 0.106735 0.106735| 2
------------------------------------------------------------------------------
| Virtual Mem Usage (GB) | Resident Mem Usage(GB) |
ID | CurrentPeak| CurrentPeak| Page Faults
------------------------------------------------------------------------------
n59| 1.458281.45828 | 0.108227 0.108227| 2
n60| 1.458281.45828 | 0.106087 0.106087| 1
n61| 1.458281.45828 | 0.108635 0.108635| 2
n62| 1.458281.45828 | 0.108311 0.108311| 2
n63| 1.458281.45828 | 0.106277 0.106277| 6
n64| 1.458281.45828 | 0.107216 0.107216| 2
n65| 1.458281.45828 | 0.108475 0.108475| 1
n66| 1.458281.45828 | 0.107117 0.107117| 1
n67| 1.458291.45829 | 0.106918 0.106918| 2
------------------------------------------------------------------------------
Total| 99.849299.8492 | 7.418257.41825 | 219
------------------------------------------------------------------------------
------------------------------------------------------------------------------------------------
| Virtual Mem Usage (GB)| Resident Mem Usage(GB)| System Mem (GB)
Hostname| CurrentPeak | CurrentPeak |
------------------------------------------------------------------------------------------------
c455-012.xx.t| 99.849299.8492| 7.418517.41851| 94.1257
------------------------------------------------------------------------------------------------
Total | 99.849299.8492| 7.418517.41851|
------------------------------------------------------------------------------------------------
SYS_STATS:
---------------------------------------------------------------------------------------
| CPU | System Mem (GB)
Hostname| Sock x Core x HTClock (MHz) Load | TotalAvailable
---------------------------------------------------------------------------------------
c455-012.xx.t| 1 x 68 x 40 17.91| 94.125781.3468
---------------------------------------------------------------------------------------
Total | 272 - -| 94.125781.3468
---------------------------------------------------------------------------------------
May 20, 2022 at 9:54 amcviveknair
SubscriberPROC-STATS:
------------------------------------------------------------------------------
| Virtual Mem Usage (GB) | Resident Mem Usage(GB) |
ID | CurrentPeak| CurrentPeak| Page Faults
------------------------------------------------------------------------------
host | 0.685974 0.685974| 0.125336 0.125336| 5
n0 | 1.458281.45828 | 0.109219 0.109219| 2
n1 | 1.458281.45828 | 0.106804 0.106804| 2
n2 | 1.458281.45828 | 0.108505 0.108505| 7
.
.
n64| 1.458281.45828 | 0.107216 0.107216| 2
n65| 1.458281.45828 | 0.108475 0.108475| 1
n66| 1.458281.45828 | 0.107117 0.107117| 1
n67| 1.458291.45829 | 0.106918 0.106918| 2
------------------------------------------------------------------------------
Total| 99.849299.8492 | 7.418257.41825 | 219
------------------------------------------------------------------------------
------------------------------------------------------------------------------------------------
| Virtual Mem Usage (GB)| Resident Mem Usage(GB)| System Mem (GB)
Hostname| CurrentPeak | CurrentPeak |
------------------------------------------------------------------------------------------------
c455-012.xx.t| 99.849299.8492| 7.418517.41851| 94.1257
------------------------------------------------------------------------------------------------
Total | 99.849299.8492| 7.418517.41851|
------------------------------------------------------------------------------------------------
SYS_STATS:
---------------------------------------------------------------------------------------
| CPU | System Mem (GB)
Hostname| Sock x Core x HTClock (MHz) Load | TotalAvailable
---------------------------------------------------------------------------------------
c455-012.xx.t| 1 x 68 x 40 17.91| 94.125781.3468
---------------------------------------------------------------------------------------
Total | 272 - -| 94.125781.3468
---------------------------------------------------------------------------------------
May 20, 2022 at 11:40 amDrAmine
Ansys EmployeeI do not issue and recommend switching hyper-threading off.
May 20, 2022 at 5:09 pmcviveknair
SubscriberHi Dr. Amine,
Im sorry I didn't quite understand your first statement. Just for my clarity, are the subprocesses being run in 68 threads (or cores) and not just a single thread (or core)?
Im fairly certain that this is the case but I just want a confirmation from someone.
I will also turn off hyper threading in subsequent runs.
Thank you.
Viewing 8 reply threads- The topic ‘Query understanding fluent batch mode .out file for parallelization.’ is closed to new replies.
Ansys Innovation SpaceTrending discussionsTop Contributors-
3492
-
1057
-
1051
-
965
-
942
Top Rated Tags© 2025 Copyright ANSYS, Inc. All rights reserved.
Ansys does not support the usage of unauthorized Ansys software. Please visit www.ansys.com to obtain an official distribution.
-