

TAGGED: 3d, ansys-student, cfd-post, fluent, fluid-flow
-
-
April 17, 2022 at 4:42 pm
ibak91
SubscriberHello,
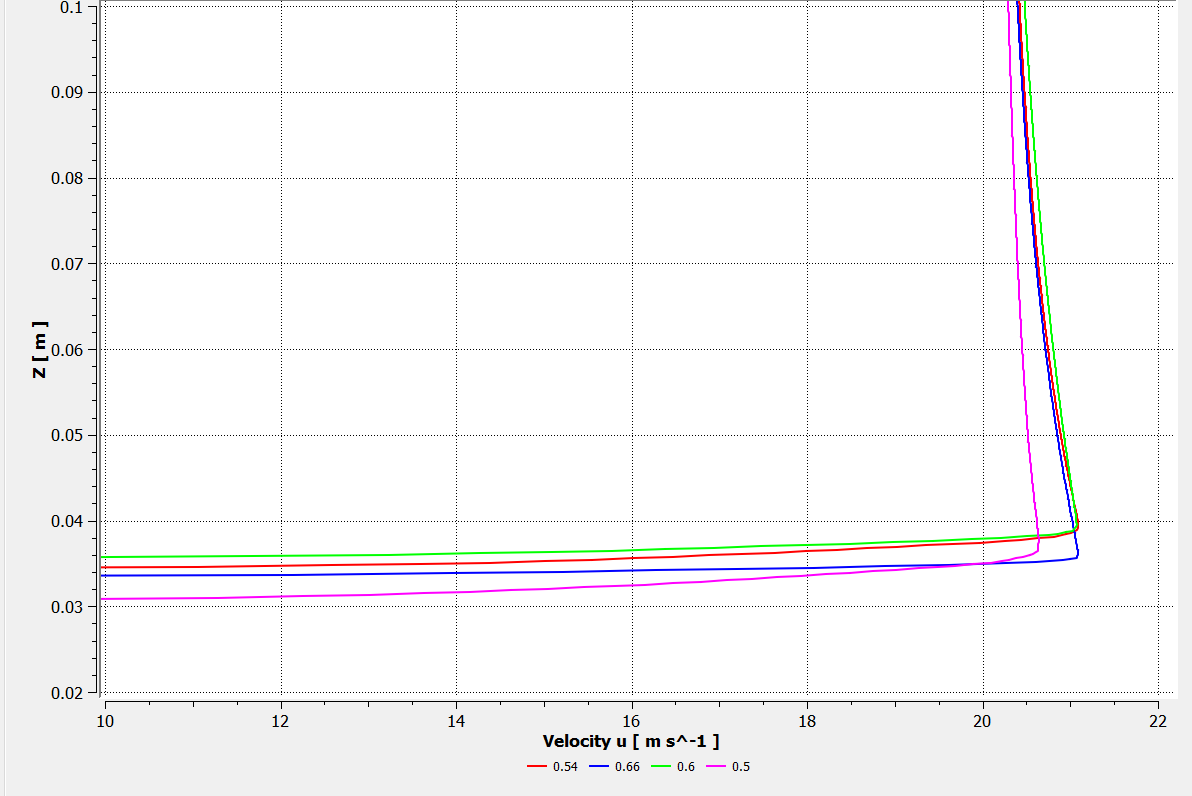
I am still pretty new to ANSYS and the forum so my apologies if this is not the right place to ask. I am simulating flow over an airship and I need to locate where the flow transitions from laminar to turbulent flow. To find the point where it transitions, I am plotting velocity profiles at multiple points over the airship using CFD-Post. The velocity profile chart demonstrates that the flow is transitioning from turbulent to laminar, which I think to be inaccurate. I am using the k-ω SST transition model and the flow is flowing towards the -x direction.
April 18, 2022 at 11:15 amSVV
Ansys EmployeeHi Please use Reynolds number to find the transition. Also ensure that your mesh quality is good and simulation is converged.
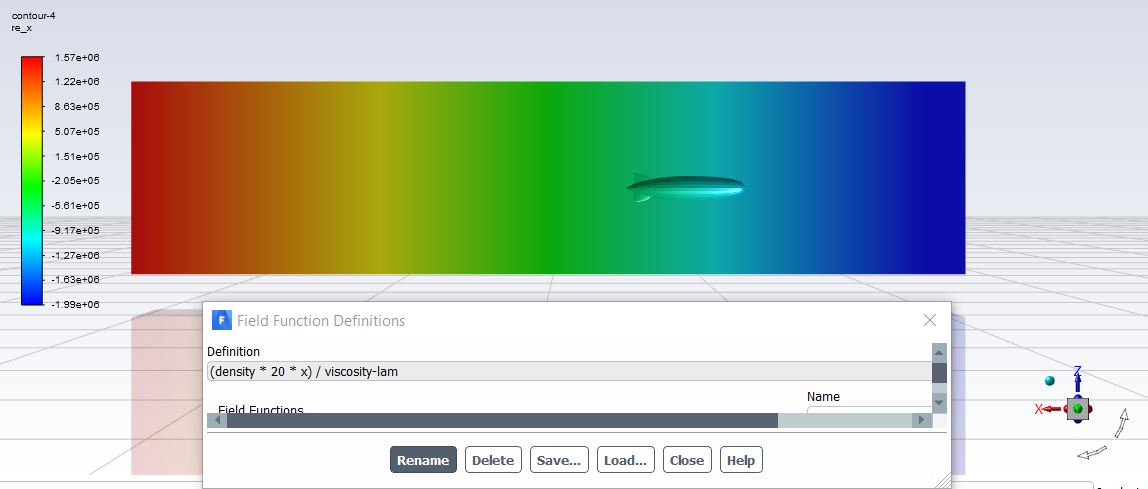
April 18, 2022 at 3:27 pmSubscriberHi I tried using Reynolds initially but when I calculated it and displayed the contour I get this. I am showing both the formula I used and the contour. As you can see the Reynolds Number from the start of the flow is negative 10^6. which is confusing.
I believe my mesh quality is good:
Mesh Quality:
Minimum Orthogonal Quality = 1.11923e-01 cell 5358761 on zone 138 (ID: 5358762 on partition: 0) at location (-3.89613e-01 -3.00474e-01 -1.81408e-03)
Maximum Aspect Ratio = 6.79135e+02 cell 5335807 on zone 138 (ID: 5335808 on partition: 0) at location (-3.89023e-01 -3.00435e-01 -1.75374e-03)
The simulation converged at 678 iterations.
April 19, 2022 at 12:11 pmRob
Forum ModeratorYou're plotting a function of the x-coordinate so Re will vary over the domain by position as well as everything else.
Cell quality is OK. How well resolved is the boundary layer, streamwise on the blimp and flow in the wake region?
April 19, 2022 at 2:19 pmSubscriberHi Rob I am sorry but I am not sure what you mean by resolved, do you perhaps mean refined? The boundary layer has 25 layers with a y+ < 1.
I just noticed that the boundary layer gradient does not go over the fins of the blimp, could that be a reason why my results are incorrect?
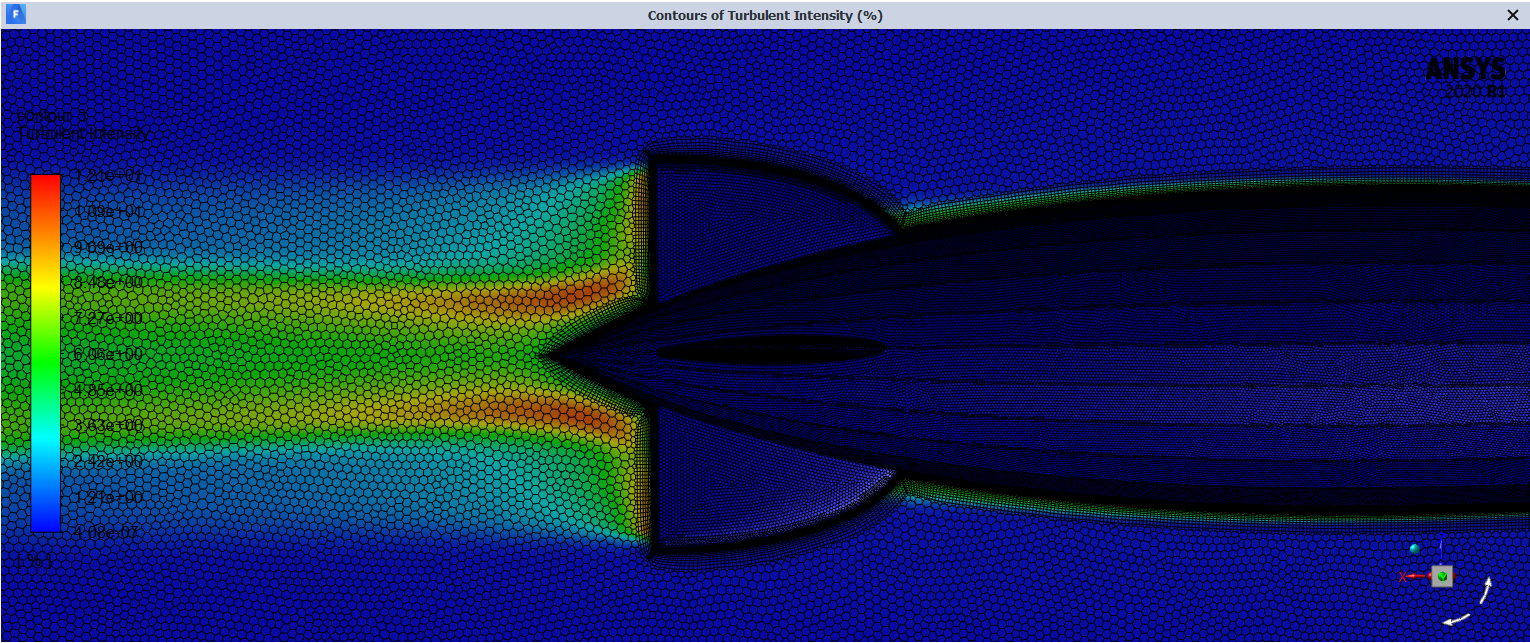
April 19, 2022 at 4:16 pmForum ModeratorPossibly. By refined I mean are you picking up the flow gradients. Everyone reads about y+ and religiously applies the "rule" then forgets to refine the far field. The jump from the top layer of inflation to the poly mesh is a little large, but not excessive.
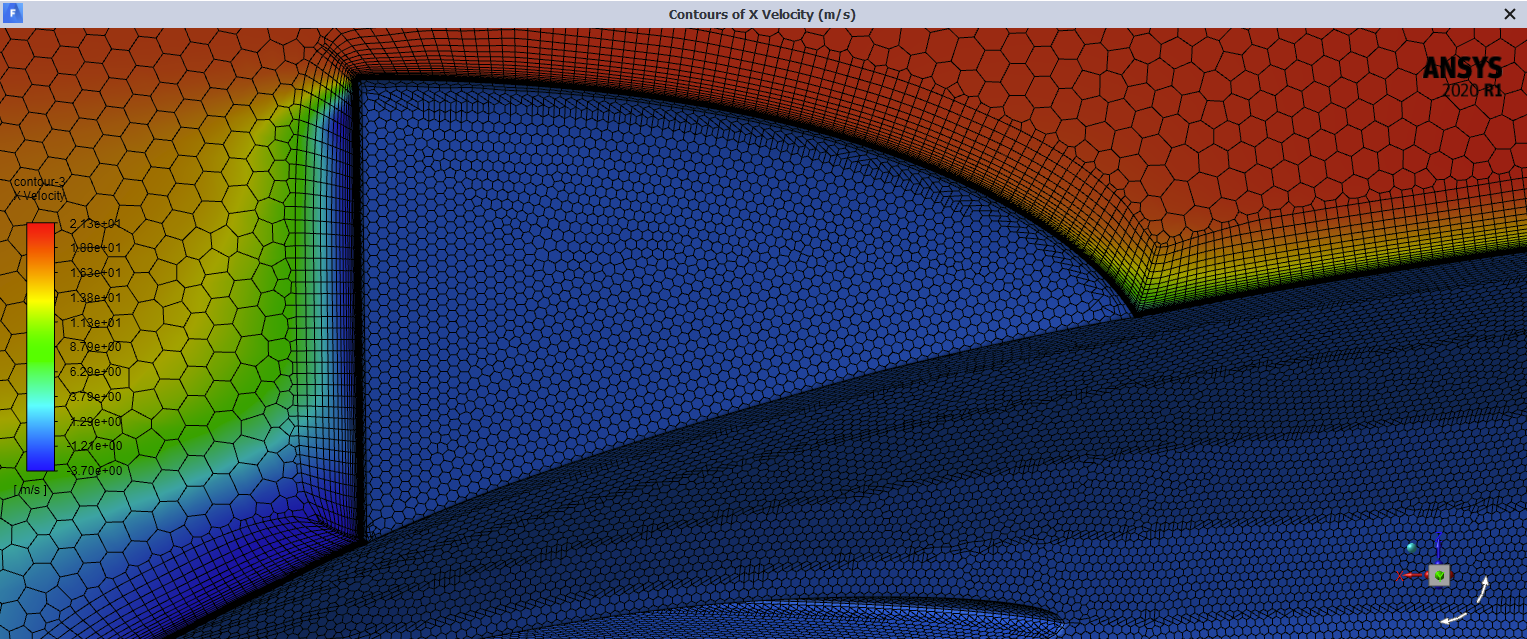
How does the above look with the velocity contour plotted?
If you're looking for when the boundary layer "trips" to turbulence you may need one of the turbulence transition models, and then monitor k and/or epsilon/omega. It's really not my field (I don't do aeroplanes) so you may need to do some reading. Nearest I got was working with some sports scans prior to the swimsuit simulation work https://www.theengineer.co.uk/speedo-uses-ansys-simulation-to-develop-racing-swimwear/
April 20, 2022 at 7:18 pmSubscriberI am currently using the K-omega SST model for my simulations, would the monitor residuals show when the boundary layer trips to turbulent? Also the velocity contour has a boundary layer only on the first 4 layers of the wall around the fins.
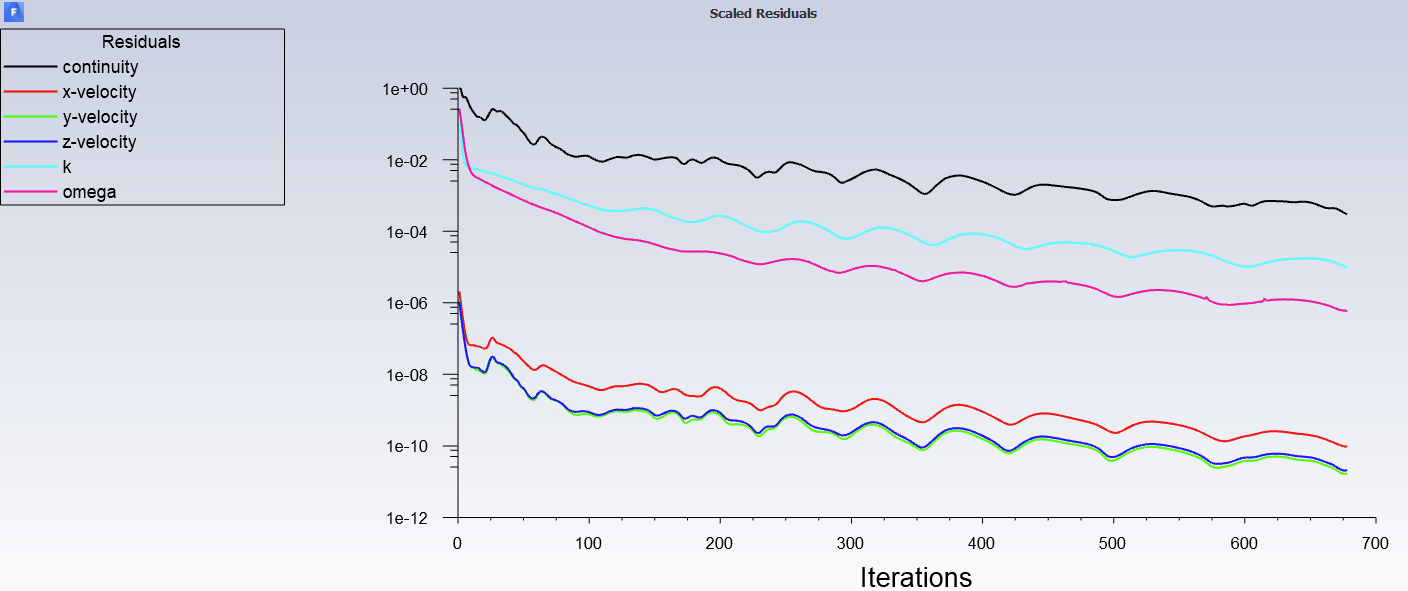
April 21, 2022 at 10:54 amForum ModeratorThe residuals are a function of the total error in the solver, as such they're used to see if the solution has converged, but are otherwise useless. What you're looking for are monitors. If you plot k and w (separately) on the blimp surface does it show anything?
Viewing 7 reply threads- The topic ‘Flow Transition using velocity profiles’ is closed to new replies.
Innovation Space Trending discussions
 Top Contributors
-
peteroznewman
 6515
6515 -
scabo
 1906
1906 -
Dennis Chen
 1463
1463 -
javat33489
 1309
1309 -
Shyam Prasad V Atri
1022
Top Rated Tags
© 2026 Copyright ANSYS, Inc. All rights reserved.
Ansys does not support the usage of unauthorized Ansys software. Please visit www.ansys.com to obtain an official distribution.
-


The Ansys Learning Forum is a public forum. You are prohibited from providing (i) information that is confidential to You, your employer, or any third party, (ii) Personal Data or individually identifiable health information, (iii) any information that is U.S. Government Classified, Controlled Unclassified Information, International Traffic in Arms Regulators (ITAR) or Export Administration Regulators (EAR) controlled or otherwise have been determined by the United States Government or by a foreign government to require protection against unauthorized disclosure for reasons of national security, or (iv) topics or information restricted by the People's Republic of China data protection and privacy laws.

 You are navigating away from the AIS Discovery experience