TAGGED: ansys-mechanical, ansys-workbench, contacts, meshing, structural
-
-
March 19, 2022 at 4:44 pm
nishantsinghbme
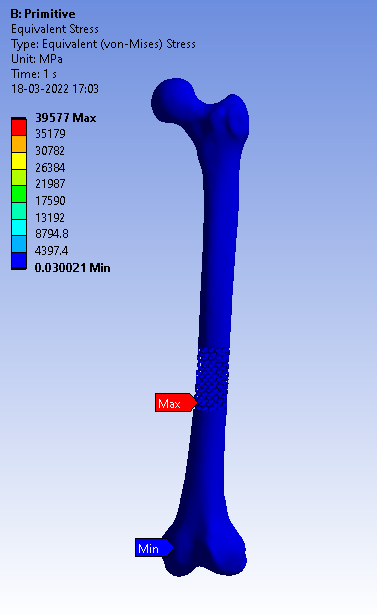
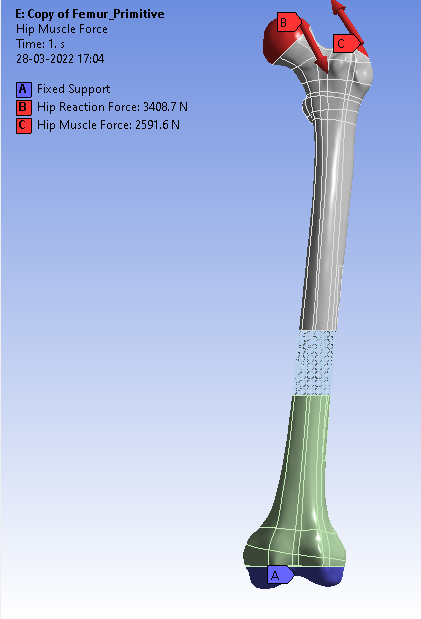
SubscriberI have done a analysis (figure attached) for a biological (femur) +porous implant. analysis was done properly but when evaluating equv stress it is showing lower region contours even the max value is shown in legends but total deformation is showing the valid patterns on same analysis. I am unable to figure out even after resetting all the graphics options.
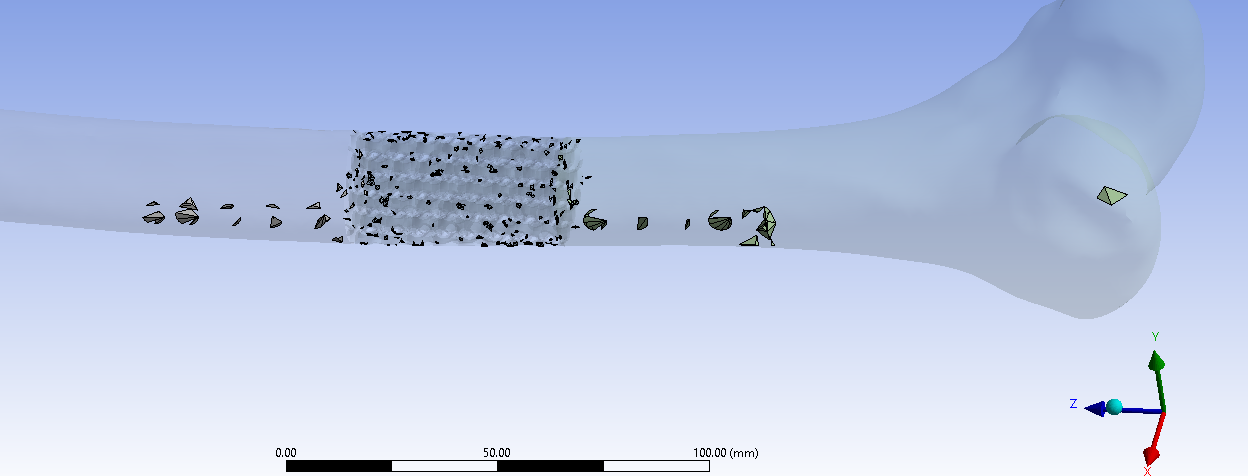
Note: model is meshed in some other software and imported as an external model in structural individually. the contact made between femur and porous scaffold was node to none by named selection logic.
Contact were made between element face to face( figure is attached
March 19, 2022 at 11:42 pmpeteroznewman
Subscriber55 mm of deformation at the top of the femur is a sign that there is a mistake in the model.
The Young's modulus for the top half may be off by an order of magnitude. Check values and the units that were used.
March 21, 2022 at 4:12 pmnishantsinghbme
SubscriberYes sir I had checked it.
The problem was on the loading directions and values. Now it has been rectified but and solution was done but still i am facing the same problem.
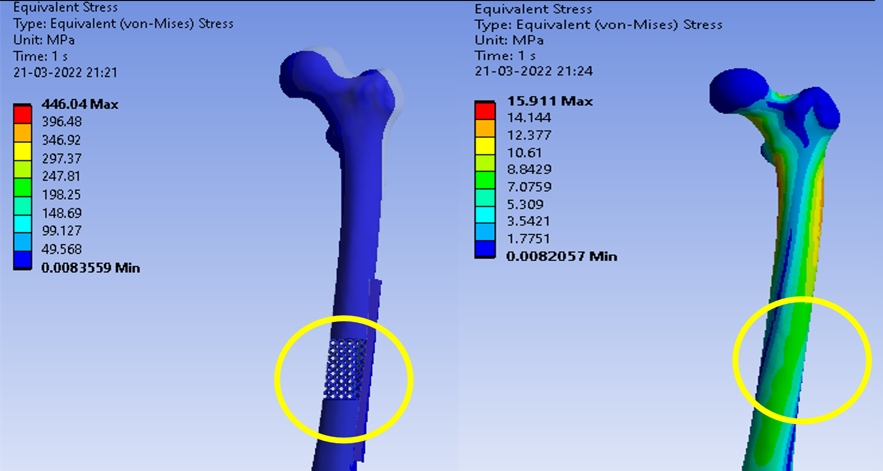
For this i have done 3 different analysis which will help to better understand my issue (Plz refer figure attached for 3 analysis given below)
1st analysis: Femur bone(bone material) with Porous Implant (Titanium)
2nd analysis: Femur bone(bone material) with Solid part (bone material)
3rd analysis: Femur bone(bone material) with Solid implant (Titanium)
Plz Help me
Thanks
March 21, 2022 at 5:06 pmpeteroznewman
SubscriberTry plotting the results using Capped Isosurfaces.
/forum/discussion/6503/contour-band-with-a-user-defined-max-min-value
March 21, 2022 at 6:00 pmnishantsinghbme
Subscribersame results and contours
March 21, 2022 at 7:18 pmpeteroznewman
SubscriberBut now you can more easily see which elements have the high stress and ZOOM IN ON THEM.
March 22, 2022 at 11:16 amnishantsinghbme
SubscriberSir even after zoom in on the i am getting the lower stress contours only (BLUE)
March 22, 2022 at 11:52 ampeteroznewman
SubscriberThe legend shows there is an element with 446 MPa of stress. Turn on the Max flag. That will show you where it is. You may have to cut a section to make it visible, but if you use Capped Isosurface, that will hide elements with stress less than 100 MPa. Look at the Details window for the Stress result, it tells you the name of the component that has the Maximum value on it. Hide the other components. If you can't manage to see the element, there is nothing more I can do for you.
 March 27, 2022 at 9:10 am
nishantsinghbme
SubscriberThank you for you valuable answer.
My point is that without implant the stress contours bands are visible in various colors.
But if I am looking for the bone assembled with implant... contours bands are only showing lower values.
From my understanding, there is few elements inside which have higher values. So, now my question is there any mistake in analysis?
The material for the bone is orthotropic and implant with plate having Ti6Al4V as supplied by ansys non linear AF material.
Contact between porous implant and bone were bonded and with plate and bone too.
there is no contact between porous implant and plate.
Thankyou for you reply in advance.
Loading conditions were same for both models i.e. whole bone and bone with plate and porous implant
March 27, 2022 at 12:04 pmpeteroznewman
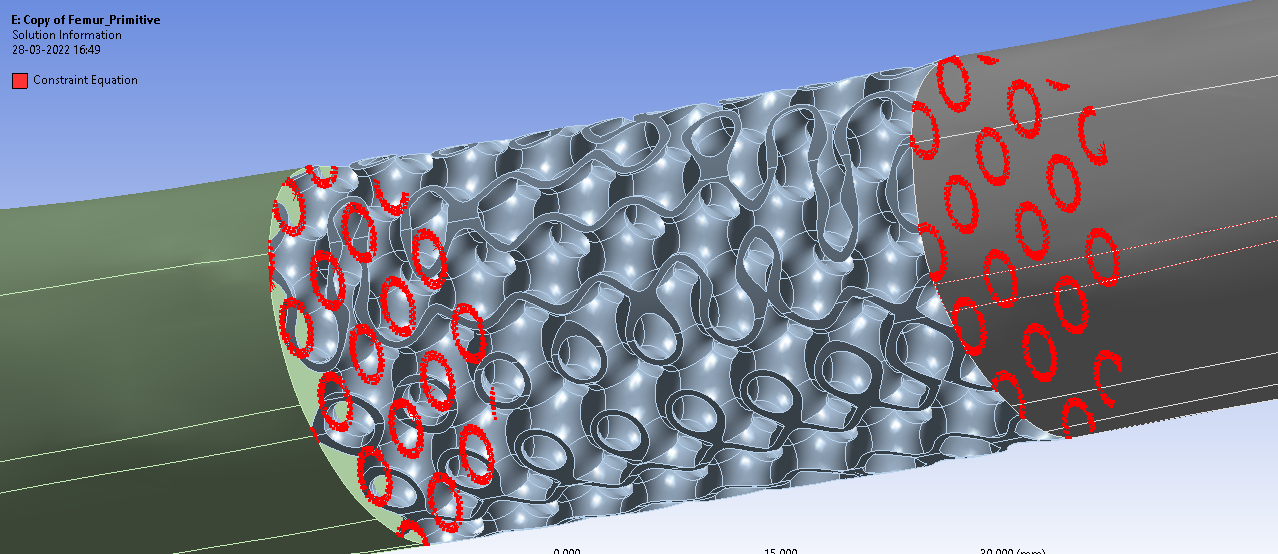
SubscriberChange the contact formulation to MPC then solve. Do you get the same result? After the solution, click on the Solution Information folder, text will appear on the Worksheet tab. Click on the Graphics tab. Now there will be a red spider showing how the contact was created across the interface. Now you can visualize how each node on one side is connected to each node on the other side.
It can sometimes happen that a spider reaches out further than it should and picks up a node that it applies more force to than all the other nodes because of the longer distance. The corrective action is to reduce the Pinball Radius to prevent the bonded contact from reaching out so far.
It can sometimes happen that a low quality element shape is created. Low quality element shapes can create erroneously higher stress values. The corrective action is to remesh to get elements with better quality shapes. You can plot the element quality under the Mesh branch and find elements at the extremely bad end of the element quality scale for many different element quality metrics.
It's possible that you have both conditions. My point is that you are concerned about high stress but won't show the element with the highest stress. Why is that?
March 27, 2022 at 1:35 pmnishantsinghbme
SubscriberI am unable to find red spider. :(
March 27, 2022 at 2:01 pmpeteroznewman
SubscriberPlease reply with an image showing the element with the highest stress.
March 28, 2022 at 11:32 amMarch 28, 2022 at 12:44 pmpeteroznewman
SubscriberNow you know that the highest stress is not at the interface. That is useful information.
Plot the element quality under the Mesh branch and find elements at the low end of the element quality scale.
March 28, 2022 at 12:56 pmMarch 28, 2022 at 11:05 pmpeteroznewman
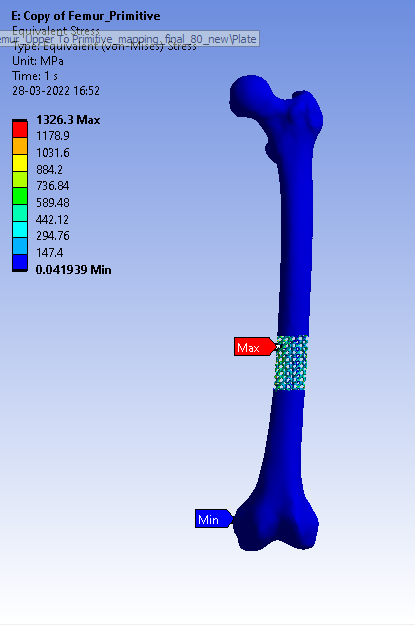
SubscriberMake a Named Selection using the Worksheet of elements with stress greater than 1320 MPa. That will make it easy to find the few elements that have high stress. Now find out the element quality of those elements.
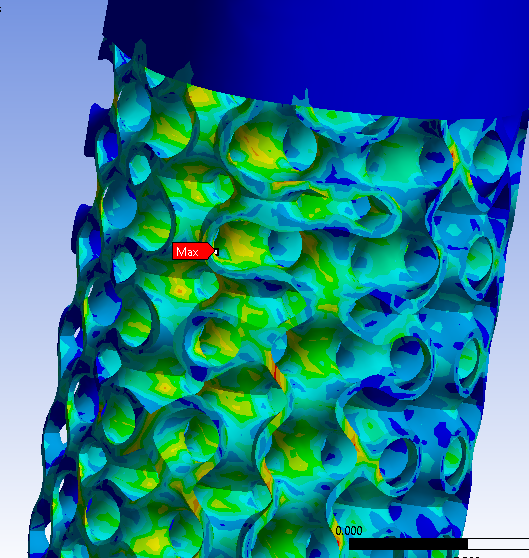
You showed the location of the maximum stress in a contour, but you didn't show the element shape of the element with the maximum stress. How many elements go through the wall thickness at that location? Use a Section View to cut through the mesh at the location of the maximum stress. Click the button to show whole elements.
Are these Linear or Quadratic Tet elements? Try using Quadratic elements if they are linear.
Try using smaller elements to get more than two elements through the wall thickness.
March 29, 2022 at 11:33 amnishantsinghbme
Subscriberon your suggestion of using quadratic element.. I have changes it
and element length were also reduced no in new analysis element edge length are as follows
Element length for bone: 2 mm and for
Implant: 0.5 mm
In this maximum stress location has been changed and max stress changed from 1326 to 1647 MPa.
The elements stress greater than 1320 are only 8 in this analysis. which is shown in figure below
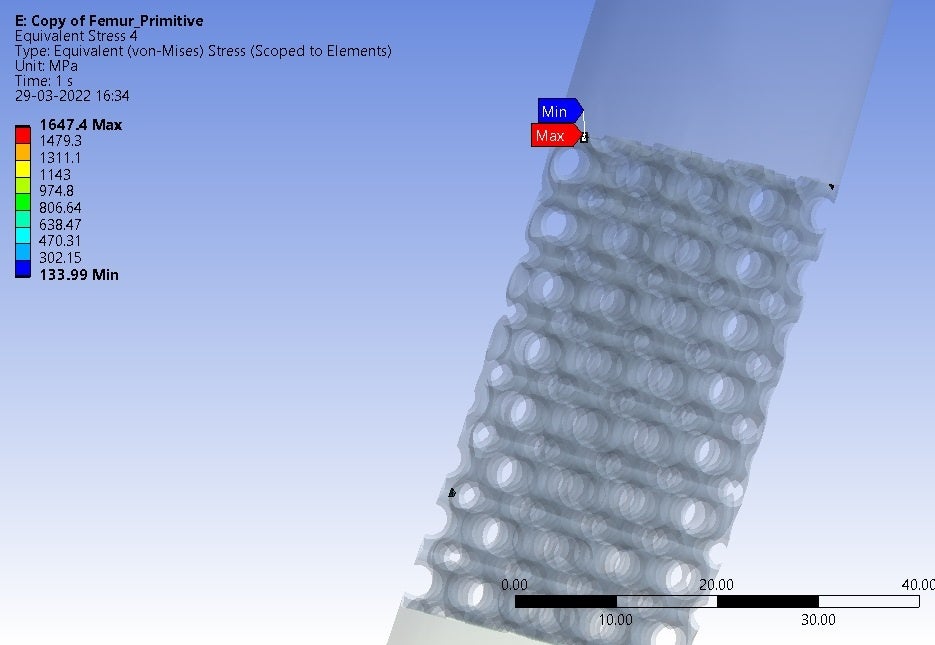 Section View to cut through the mesh at the location of the maximum stress figure below

 The element quality for those 8 elements on the skewness scale were greater than 0.95 which show the worst element quality.
This i had understand well. Thankyou for your valuable suggestions.
Now i am still in doubt that why the elements of bone regions are showing very less stress (whole blue region in the bone area ).
Same this is also happening when I am replacing the porous implant with solid titanium too.
Please see the section view of meshed element in figure below as you asked to upload

As per my understanding analysis is going well but are these stress pattern are due to material bone and titanium? it it is then why?
Please give some suggestions on the above or still there is some mistake in analysis?
Thankyou In advance
March 29, 2022 at 2:23 pmpeteroznewman
SubscriberAnalysts will sometimes exclude a layer of elements on either side of a bonded contact because the bonded contact is an approximation which can create a high stress artifact. You can create a Named Selection of Elements using the Worksheet to select elements by Z coordinate. Make several rows so that a layer of elements on either side of the bonded contact are excluded from the selection. Use this Named Selection to plot the stress.
Stress results on element shapes with low quality can have a high stress artifact. Geometry improvements can enable better element shapes. Virtual Topology can enable better element shapes. But if you don't have geometry and the mesh is created in an external program, then you must fix the shape there. Generally smaller element sizes are going to create higher quality element shapes.
If you can't get element shapes of a sufficiently high quality, then you can create a Named Selection to exclude elements of low quality from a Stress result plot.
March 30, 2022 at 5:24 amnishantsinghbme
Subscriberin my first post I was using other program to generate the meshes. Later i was using geometry (.step ) files for same analysis. Virtual topology was also used in all the analysis to merge the bone edges. Indeed, virtual topology enabled the better element shapes.
On your suggestions I will exclude the layer of elements from the bonded contacts by named selections and will se if stress variations occurs.
Still I have to figure it out the stress patterns.
Now I am trying generate the custom range of stress patterns to visualize the higher order stress contours on the bone. For this I am using modified form of the equation from the post /forum/discussion/7253/specifc-range-in-results-of-static-structural-analysis-in-ansys-mechanical
i.e 0.5*(SEQV + 2e6 - abs(SEQV - 2e6))....I am able to modify the maximum value of stress results but unable to modify the minimum value.
Over all I really appreciate your help on my every doubt and post. Thanks a lot.
Viewing 18 reply threads- The topic ‘why contour is not plotted by ansys even showing proper stress pattern?’ is closed to new replies.
Innovation SpaceTrending discussionsTop Contributors-
4989
-
1670
-
1386
-
1243
-
1021
Top Rated Tags© 2026 Copyright ANSYS, Inc. All rights reserved.
Ansys does not support the usage of unauthorized Ansys software. Please visit www.ansys.com to obtain an official distribution.
-
The Ansys Learning Forum is a public forum. You are prohibited from providing (i) information that is confidential to You, your employer, or any third party, (ii) Personal Data or individually identifiable health information, (iii) any information that is U.S. Government Classified, Controlled Unclassified Information, International Traffic in Arms Regulators (ITAR) or Export Administration Regulators (EAR) controlled or otherwise have been determined by the United States Government or by a foreign government to require protection against unauthorized disclosure for reasons of national security, or (iv) topics or information restricted by the People's Republic of China data protection and privacy laws.

