Ansys Assistant will be unavailable on the Learning Forum starting January 30. An upgraded version is coming soon. We apologize for any inconvenience and appreciate your patience. Stay tuned for updates.
I am trying to see the magnetic field distribution on a sheet for a simulation model right now. However, the Mag_B that is plotted contains all components. Is there a way to only plot Mag_B with the X, Y or Z component?
best,
H2020
February 2, 2022 at 11:18 am
Navya Chode
Forum Moderator
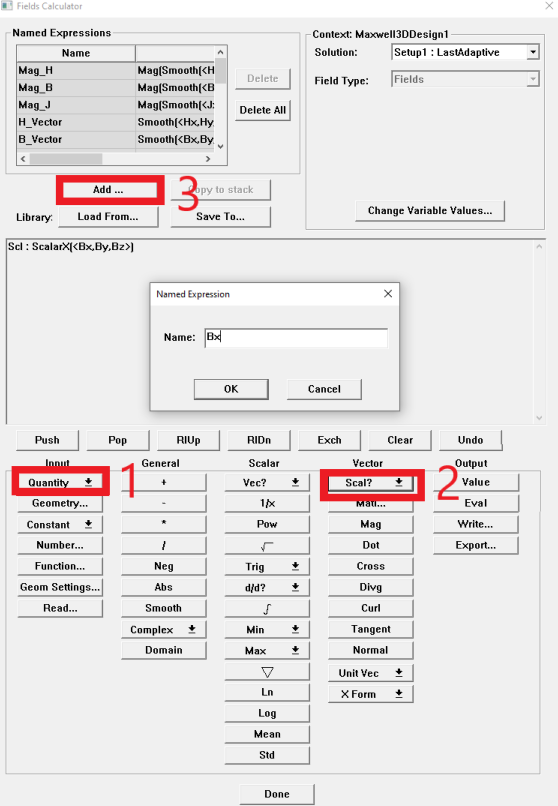
you can create a polyline as the circular path (OR any path you want) first -> use field calculator to create named expression Bx
In field calculator, Input: Quantity->B
Vector: Scalar?->ScalarX
Add..->Type the name as "Bx"
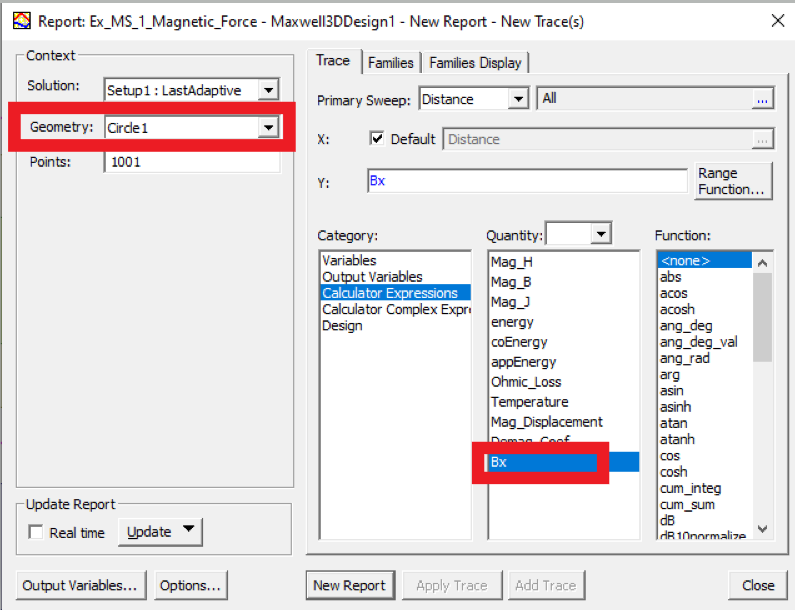
Create a field report-> select the circle(or the path you crated) in geometry ->add Bx from Calculator Expressions->New report Regards
Navya
February 2, 2022 at 2:40 pm
H2020
Subscriber
Thanks for the reply. I followed your instructions and plotted a field overview of the scalar X component. Is is necessary to apply the smooth() and Mag() commands to your code as well? Since those are the operators used on the Mag_B expression as well.
Best
H2020
Viewing 2 reply threads
The topic ‘How to plot field overlay of X component of Mag_B?’ is closed to new replies.
The Ansys Learning Forum is a public forum. You are prohibited from providing (i) information that is confidential to You, your employer, or any third party, (ii) Personal Data or individually identifiable health information, (iii) any information that is U.S. Government Classified, Controlled Unclassified Information, International Traffic in Arms Regulators (ITAR) or Export Administration Regulators (EAR) controlled or otherwise have been determined by the United States Government or by a foreign government to require protection against unauthorized disclosure for reasons of national security, or (iv) topics or information restricted by the People's Republic of China data protection and privacy laws.
Please Login to Report Topic
Please Login to Share Feed
Edit Discussion
You are navigating away from the AIS Discovery experience
The Ansys Learning Forum is a public forum. You are prohibited from providing (i) information that is confidential to You, your employer, or any third party, (ii) Personal Data or individually identifiable health information, (iii) any information that is U.S. Government Classified, Controlled Unclassified Information, International Traffic in Arms Regulators (ITAR) or Export Administration Regulators (EAR) controlled or otherwise have been determined by the United States Government or by a foreign government to require protection against unauthorized disclosure for reasons of national security, or (iv) topics or information restricted by the People's Republic of China data protection and privacy laws.