
TAGGED: structural-mechanics
-
-
January 2, 2022 at 12:37 pm
Muhammadkhizer
Subscriber- Linear buckling analysis is done.
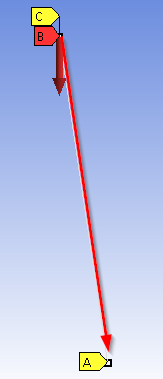
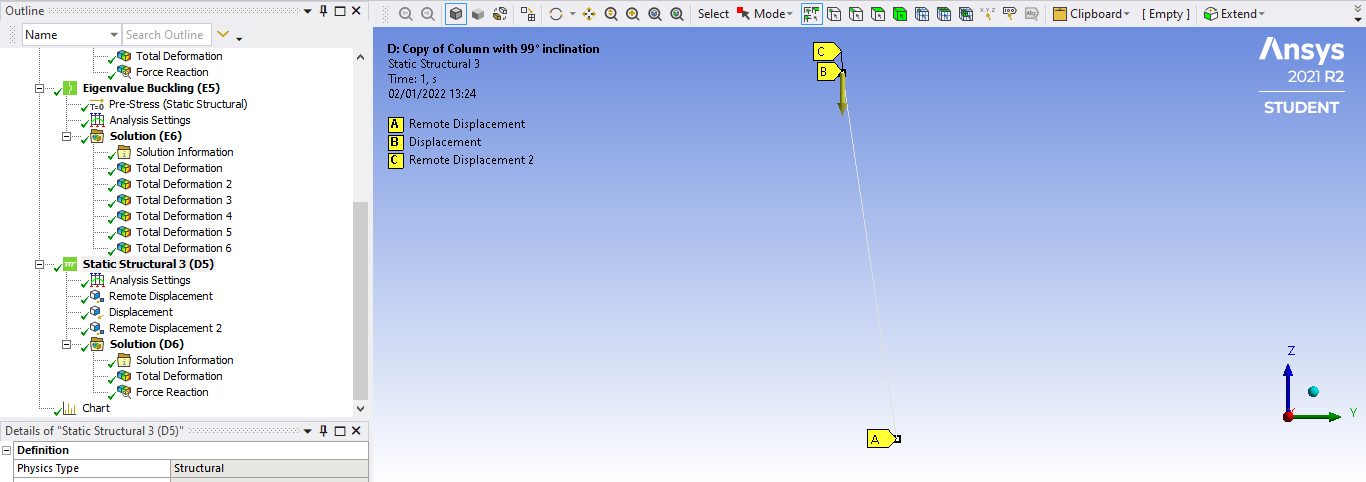
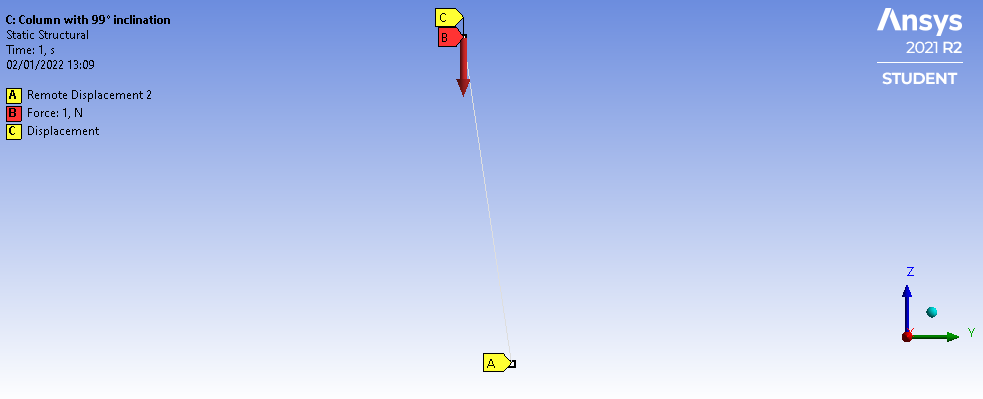
Model Setup: Column as beam element. Pinned condition both ends.
January 2, 2022 at 10:51 pmpeteroznewman
SubscriberWhen comparing a Linear Buckling model with a Hand Calculation, the Force should act along the center of the beam. This model shows an angle between the force and the beam axis. If you make the force along the beam axis, you should see the ANSYS result match the Hand Calculation value exactly.
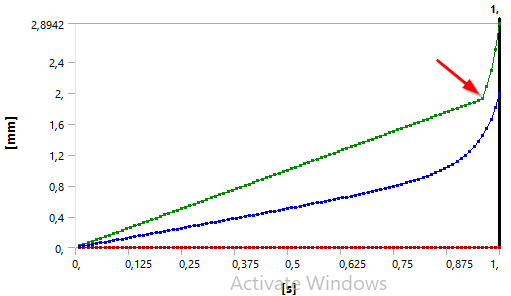
 In the nonlinear model, the knee in the displacement plot is the time at which buckling occurred. Match the Reaction Force at that time to report the Buckling Force.
 January 4, 2022 at 2:27 amSubscriber@peteroznewman
I have a follow-up question.
I have applied this nonlinear analysis method with the help of this previous Ansys forum discussion.
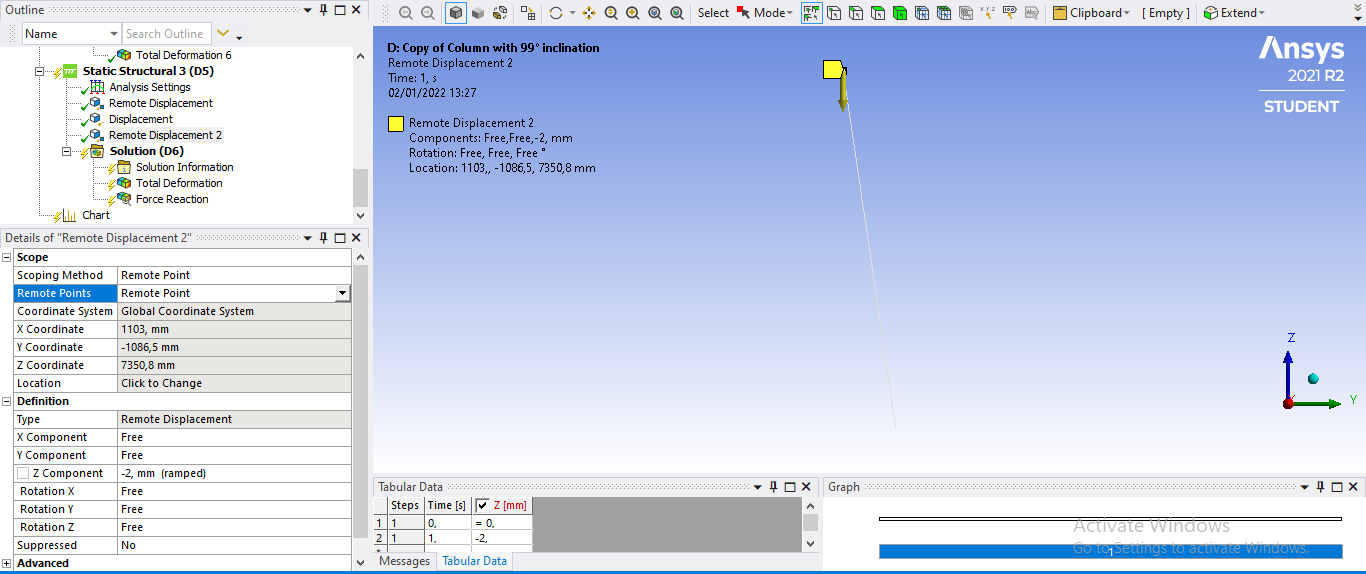
In the nonlinear static analysis, what is the purpose of applying 2mm vertical remote displacement in the y-direction? 1mm offset is provided in the x-direction for imperfection. I get this point.
For reference, I am pasting the comment below:
From this Previous post:
I did a slender column, the cross-section is 0.2 x 0.2 m and the length is 10 m with Steel where E = 200 GPa.
I usedthis websiteto compute the Euler solution. The critical buckling load is 596.8 kN.
The ANSYS Eigenvalue Buckling solution for that load was a Load Multiplier of 1.1 so the critical buckling load is 656.5. kN, which is about 10% over the Euler solution.
The model was copied to a Nonlinear Static Structural model where a Remote Displacement on the 200 x 200 mm top face was offset by 1 mm from the center to provide a small eccentricity to seed the buckling along the x-axis.Here is the force-time plot where at t=1, the vertical displacement was 2 mm. You can see that the force is 653 kN, which is very close to the Eigenvalue result of 656.5 kN.
I have applied the same thing in my Non-linear analysis setup: But I am not sure about the purpose of applying the 2mm vertical displacement.
Why not apply 1mm displacement.?
Why not apply the buckling load ( force * load multiplier ) which is obtained from eigenvalue buckling analysis. ?
The model was copied to a Nonlinear Static Structural model where a Remote Displacement on the top edge was offset by 1 mm from the center to provide a small eccentricity to seed the buckling along the x-axis.
In this result, in the nonlinear model, the knee in the displacement plot is the time at which buckling occurred.
The knee is representing that after this time the displacement will be non-linear? i.e the column will buckle.

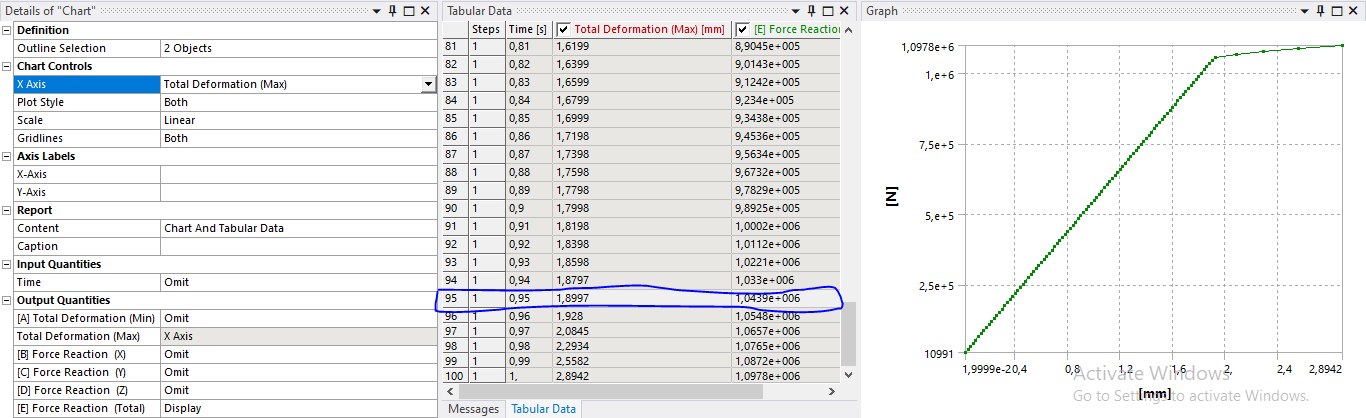 I have created a chart between displacement and force reaction. according to this chart, the buckling load will be 1,0439e+006 N?
From my understanding, the displacement is increasing rapidly after this time. That is the reason it is a buckling point. Is this reason?
Eigenvalue critical buckling load =1,1781e+006 N
Nonlinear buckling load = 1,0439e+006 N
The difference in the result is big. Is this a reasonable result?
Thanks in advance.
January 4, 2022 at 2:46 amSubscriberApplying displacement instead of force provides easy convergence and so long as no additional constraints were used is equivalent to the force.
2 mm is appropriate for that model and seems to be good for your model also. At 1 mm of compression, the column has not buckled.
Around 2 mm of compression, there is a sudden increase in the rate of lateral deformation, which is the definition of buckling.
The nonlinear buckling load should be less than the Eigenvalue critical buckling load and the difference is only 12%, which sounds reasonable to me.
I expect if you cut the 1mm eccentricity in half, the nonlinear buckling might go a little higher, but you will have to pack in lots more output points to catch it precisely.
Viewing 3 reply threads- The topic ‘Evaluation of non-linear buckling analysis result’ is closed to new replies.
Innovation Space Trending discussions
 Top Contributors
-
peteroznewman
 6154
6154 -
scabo
 1906
1906 -
Dennis Chen
 1442
1442 -
javat33489
 1308
1308 -
Shyam Prasad V Atri
1022
Top Rated Tags
© 2026 Copyright ANSYS, Inc. All rights reserved.
Ansys does not support the usage of unauthorized Ansys software. Please visit www.ansys.com to obtain an official distribution.
-


The Ansys Learning Forum is a public forum. You are prohibited from providing (i) information that is confidential to You, your employer, or any third party, (ii) Personal Data or individually identifiable health information, (iii) any information that is U.S. Government Classified, Controlled Unclassified Information, International Traffic in Arms Regulators (ITAR) or Export Administration Regulators (EAR) controlled or otherwise have been determined by the United States Government or by a foreign government to require protection against unauthorized disclosure for reasons of national security, or (iv) topics or information restricted by the People's Republic of China data protection and privacy laws.
