How to compare Multiple Static Structural Results (Contour Plots) using ANSYS Student Workbench 2021

-
-
November 12, 2021 at 2:27 pm
RushilShah
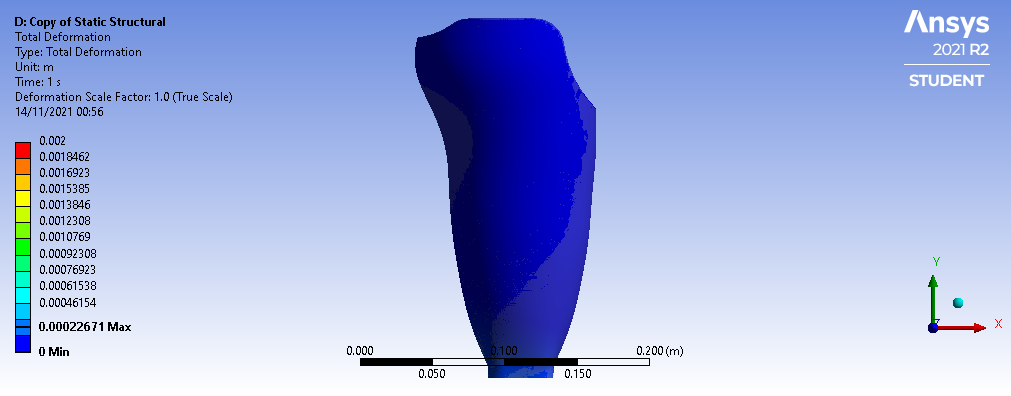
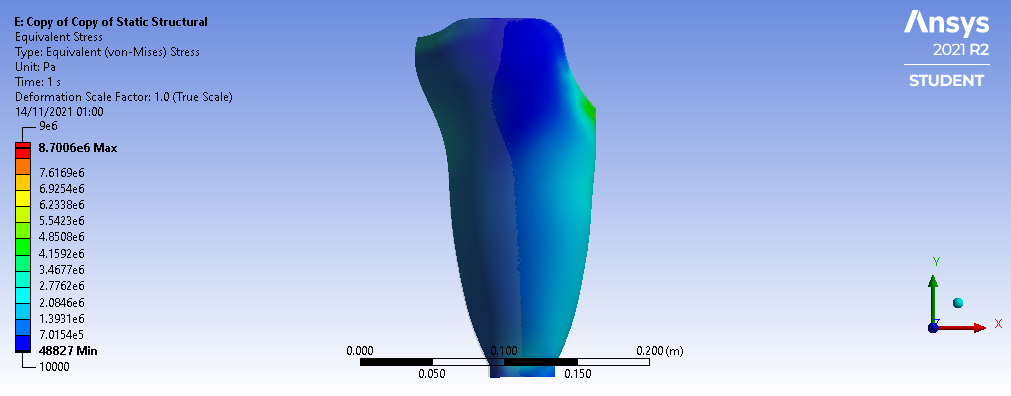
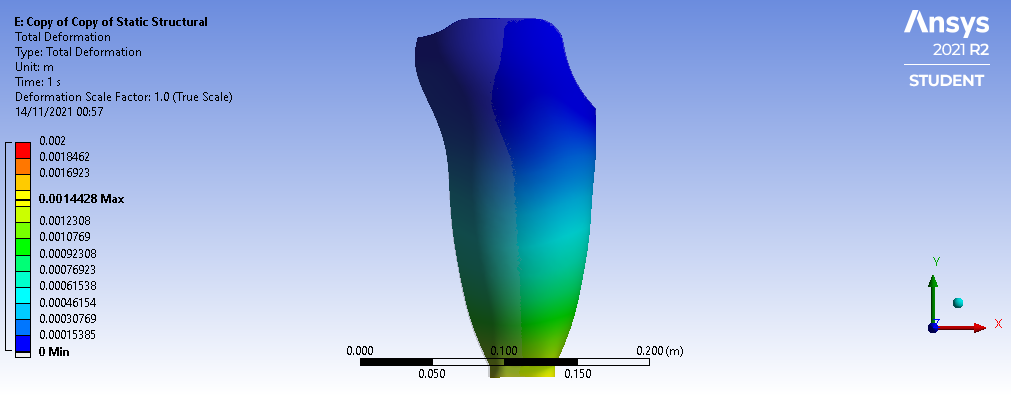
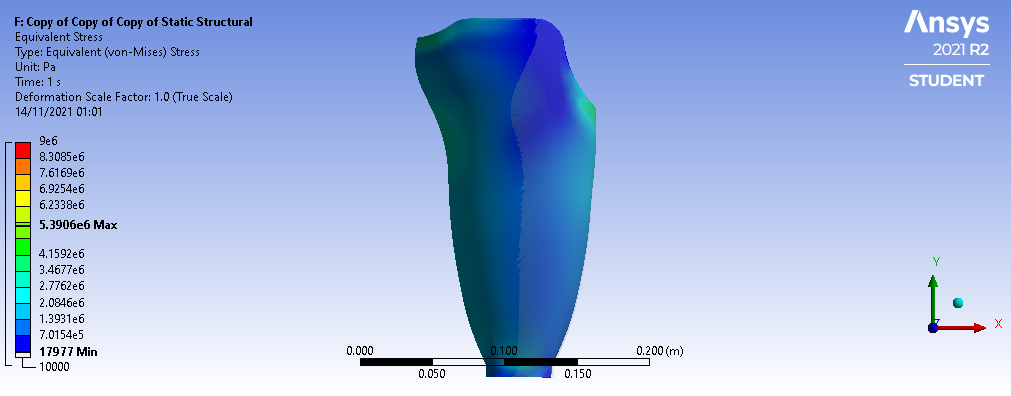
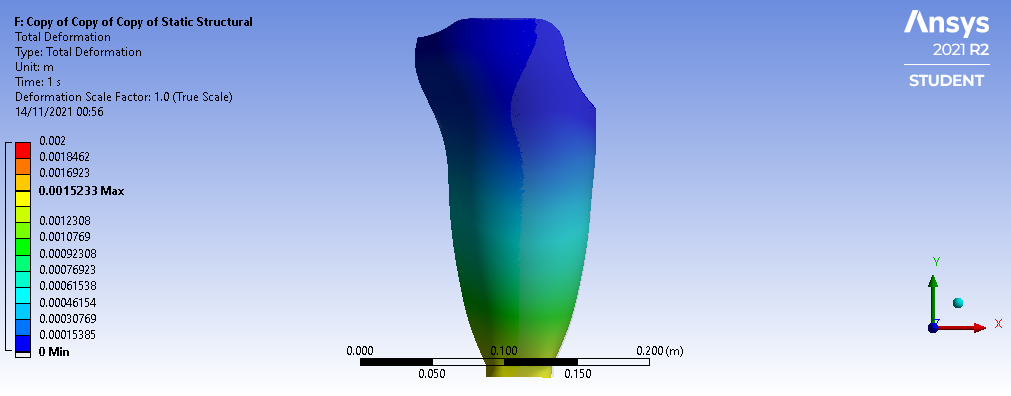
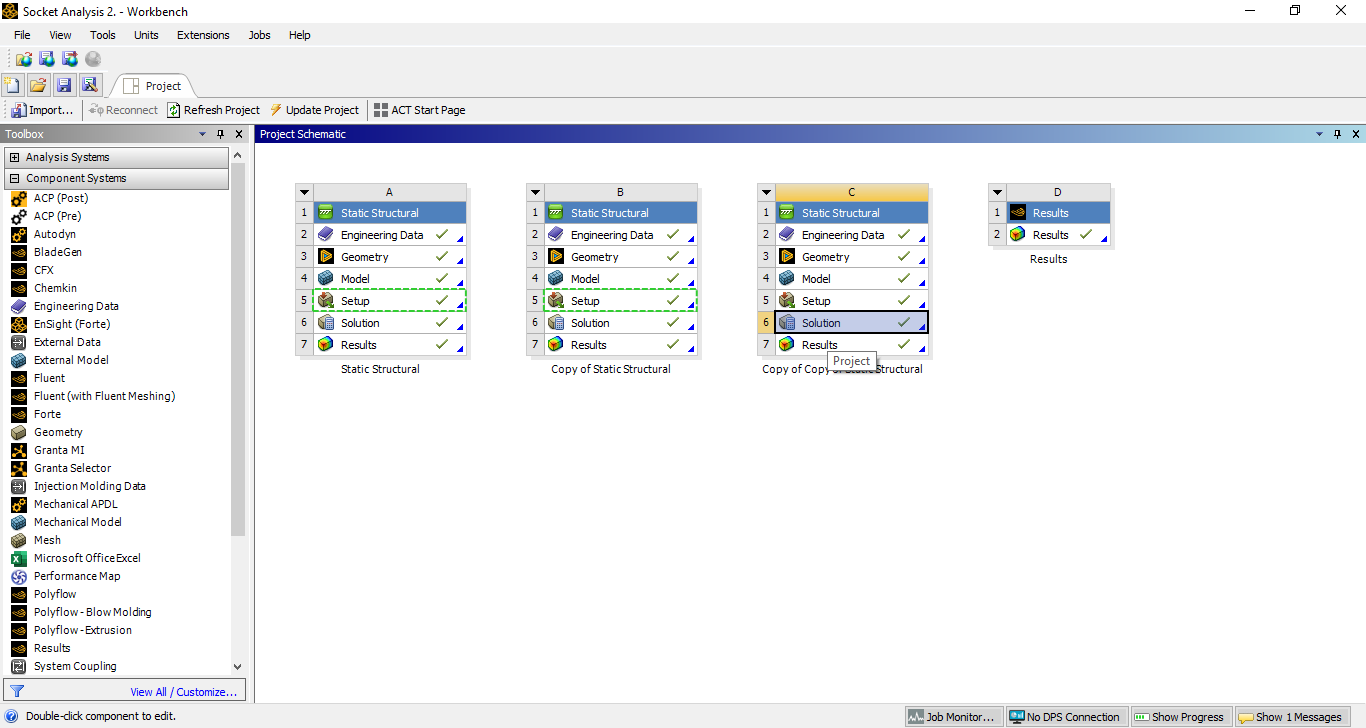
SubscriberI'm currently working on a project in which I want to simulate stress distribution at 3 different angles of load. I'm using Static Structural model for this. In all the models engineering data, geometry, mesh, fixed supports and magnitude of the force are same and only change is in the angle of the force vector.
1) How can I compare results ( of contour plots) obtained from all these models ?
While comparing them, I want to keep the range of the contour plot same for all the results.
2) Is there a way to animate all of them simultaneously ?
3) Is there a way to export compared result in animation form and image form as well ?
November 13, 2021 at 2:26 pmpeteroznewman
Subscriber1) Look at this discussion: /forum/discussion/18108/changing-scalar-range
and read this pdf file: https://www.padtinc.com/blog/wp-content/uploads/sites/2/2016/09/PADT_Mechanical_Custom_Legend_R17.pdf
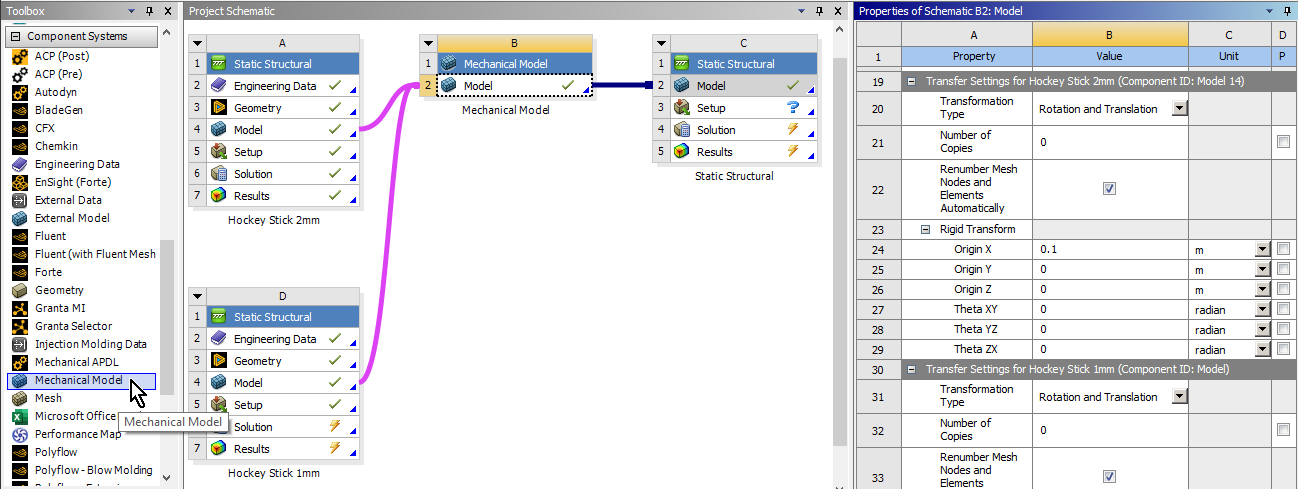
2) If you want to see all three load cases on the screen at the same time, one way to do that is to combine the models into the same model using a Mechanical Model component. In that component, you can offset one of the models so they can be seen side-by-side. Then you have to define the loads and boundary conditions and solve the new combined system to get new results. Here is an example with two systems. If you are on the Student license, you might exceed the allowable number of nodes and elements doing this. The other way to do this is if you have video editing skills. Just export the three videos and use video editing tools to insert the three videos into a new video file positioned side-by-side in a frame that is 3 times wider than the individual videos. A free, open-source tool that could do this is ffmpeg.
 A different way to do this is to show the three videos sequentially instead of simultaneously. To do that, you would use a multistep analysis. Use just a single Static Structural system, and under Analysis Settings, make it a 6 step solution. Have the force defined using Components. For each angle, make a table of the X,Y,Z components of the force. Now the Force Tabular input will have six rows and four columns: Time, X, Y, Z. At time 1, put in the components for the first angle. On the next row, for time =2, type 0,0,0. For time = 3, enter the components for the second angle. For time = 4, type 0,0,0. Time = 5 the last angle. Time 6, 0,0,0. In that way, you will have one video that goes up to the force at angle A then down to zero, up to the force at angle B, then down to zero and finally up to the force at angle C and down to zero.
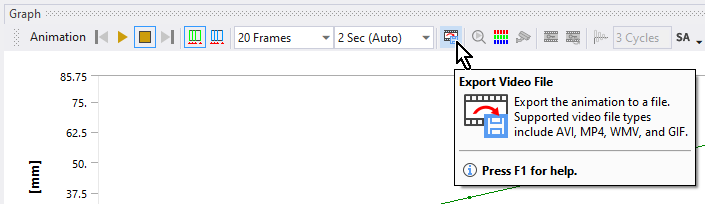
3) You can export videos from the Animation toolbar.
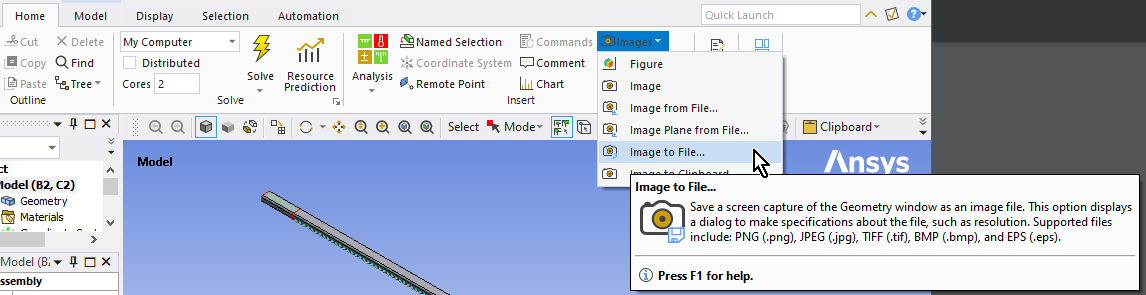
 You can export images from Mechanical using the Images button on the Home Tab.
 November 13, 2021 at 7:36 pmSubscriberThank you so much for taking out time to understand my issue and providing so many options to solve it.
I followed as per step 1 and kept Range same for all the models. But still I am unable to use 'Results' to compare all the models.
I am trying to follow as shown in this video. https://youtu.be/clccZEmyO10
All the other solutions provided by you are good for one time use but not suitable for repeated work. In future complexity of the project, variables and design are going to change often. To compare in such scenario, use of 'Results' system as shown in above YouTube video at 7:38 .
Can you help me in finding out why I am unable to compare these models using 'Results' system as shown in the video ?
Thanks !
November 13, 2021 at 9:27 pmSubscriberThe video shows Workbench 17.2 and in that version, you could use the Results component for Mechanical and CFD Post Processing. In recent versions, ANSYS dropped the ability of Results to plot Mechanical results. It is only for CFD results now.
If you have a large number of results to compare, it will be better to find a small number of representative numerical metrics for each solution and just save a few numbers to track as the variables and design changes. You don't need the whole contour plot to keep track of a maximum value.
Viewing 3 reply threads- The topic ‘How to compare Multiple Static Structural Results (Contour Plots) using ANSYS Student Workbench 2021’ is closed to new replies.
Innovation Space Trending discussions
 Top Contributors
-
peteroznewman
 6485
6485 -
scabo
 1906
1906 -
Dennis Chen
 1458
1458 -
javat33489
 1308
1308 -
Shyam Prasad V Atri
1022
Top Rated Tags
© 2026 Copyright ANSYS, Inc. All rights reserved.
Ansys does not support the usage of unauthorized Ansys software. Please visit www.ansys.com to obtain an official distribution.
-


The Ansys Learning Forum is a public forum. You are prohibited from providing (i) information that is confidential to You, your employer, or any third party, (ii) Personal Data or individually identifiable health information, (iii) any information that is U.S. Government Classified, Controlled Unclassified Information, International Traffic in Arms Regulators (ITAR) or Export Administration Regulators (EAR) controlled or otherwise have been determined by the United States Government or by a foreign government to require protection against unauthorized disclosure for reasons of national security, or (iv) topics or information restricted by the People's Republic of China data protection and privacy laws.
