Tagged: 15, fluent, fluid-dynamics, RANS Models, turbulence
-
-
June 5, 2023 at 7:06 am
 FAQParticipant
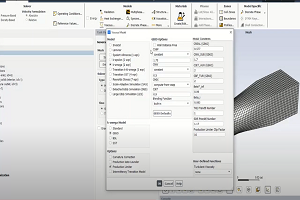
Yes, it is possible to visualize the F1 and F2 blending functions for SST model Simply use solve/set/expert in TUI and answer Yes to the question “Keep temporary memory from being freed”, perform at least one iteration and then you are able to see an extended list of the postprocessing options in the “Display Contours” tab under “Turbulence”.
-


Introducing Ansys Electronics Desktop on Ansys Cloud
The Watch & Learn video article provides an overview of cloud computing from Electronics Desktop and details the product licenses and subscriptions to ANSYS Cloud Service that are...

How to Create a Reflector for a Center High-Mounted Stop Lamp (CHMSL)
This video article demonstrates how to create a reflector for a center high-mounted stop lamp. Optical Part design in Ansys SPEOS enables the design and validation of multiple...

Introducing the GEKO Turbulence Model in Ansys Fluent
The GEKO (GEneralized K-Omega) turbulence model offers a flexible, robust, general-purpose approach to RANS turbulence modeling. Introducing 2 videos: Part 1 provides background information on the model and a...

Postprocessing on Ansys EnSight
This video demonstrates exporting data from Fluent in EnSight Case Gold format, and it reviews the basic postprocessing capabilities of EnSight.

- How to overcome the model information incompatible with incoming mesh error?
- Is there a way to get the volume of a register using expression ?
- Skewness in ANSYS Meshing
- What are the requirements for an axisymmetric analysis?
- Fluent GPU Solver Hardware Buying Guide
- What are pressure-based solver vs. density-based solver in FLUENT?
- How to create and execute a FLUENT journal file?
- How to get information about mesh cell count and cell types in Fluent?
- What is a .wbpz file and how can I use it?
- How can I Export and import boxes / Systems from one Workbench Project to another?

© 2026 Copyright ANSYS, Inc. All rights reserved.

