Tagged:
-
-
June 3, 2022 at 1:43 pm
 Watch & LearnParticipant
“This video introduces the ANSYS RedHawk Graphical User Interface (GUI) to help you effectively use the tool to identify and uncover design issues while performing a dynamic voltage drop (DvD) analysis. This video highlights basic features, such as debug and root causing dynamic voltage (DvD) drop issues to identify problems such as insufficient decaps, high simultaneous switching issues, etc.
https://www.youtube.com/watch?v=u-DjFJHq_R4”
-


Introducing Ansys Electronics Desktop on Ansys Cloud
The Watch & Learn video article provides an overview of cloud computing from Electronics Desktop and details the product licenses and subscriptions to ANSYS Cloud Service that are...

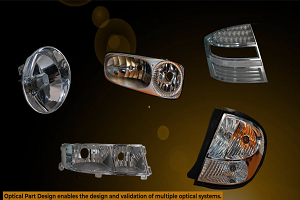
How to Create a Reflector for a Center High-Mounted Stop Lamp (CHMSL)
This video article demonstrates how to create a reflector for a center high-mounted stop lamp. Optical Part design in Ansys SPEOS enables the design and validation of multiple...

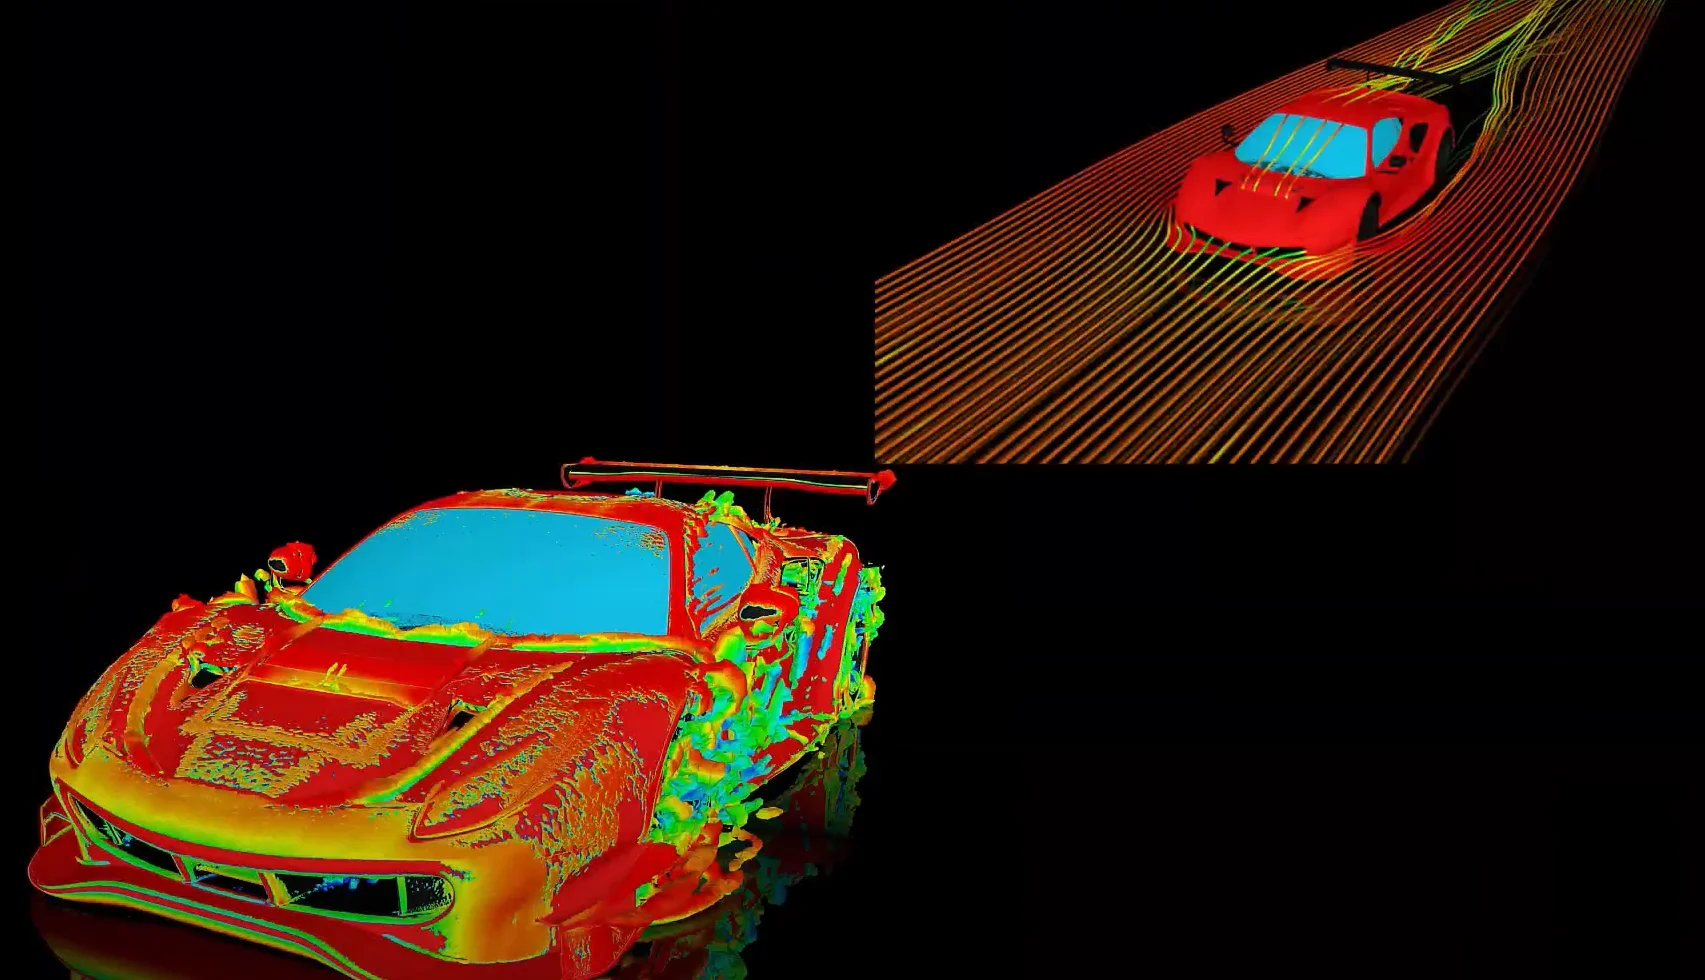
Introducing the GEKO Turbulence Model in Ansys Fluent
The GEKO (GEneralized K-Omega) turbulence model offers a flexible, robust, general-purpose approach to RANS turbulence modeling. Introducing 2 videos: Part 1 provides background information on the model and a...

Postprocessing on Ansys EnSight
This video demonstrates exporting data from Fluent in EnSight Case Gold format, and it reviews the basic postprocessing capabilities of EnSight.

- ANSYS RedHawk: Best Practices for using RedHawk Graphical User Interface
- ANSYS RedHawk: Debugging Static IR Drop
- ANSYS Totem: Introduction to the Graphical User Interface
- ANSYS Totem: Debugging IR Drop issues
- ANSYS Totem: GDS Based Early Analysis
- ANSYS RedHawk: Performing Data Integrity Checks
- ANSYS Totem: Debugging Power EM Issues
- ANSYS RedHawk: Debugging Dynamic Voltage Drop (DvD) Hotspots
- ANSYS Totem: Debugging Signal EM Issues

© 2026 Copyright ANSYS, Inc. All rights reserved.

