-
-
February 17, 2023 at 4:29 am
azarulsani
SubscriberI would like to know, what is the unit for the y axis graph such as the E & T under the Frequency domain field and power monitor? Why it is not being labelled automatically?
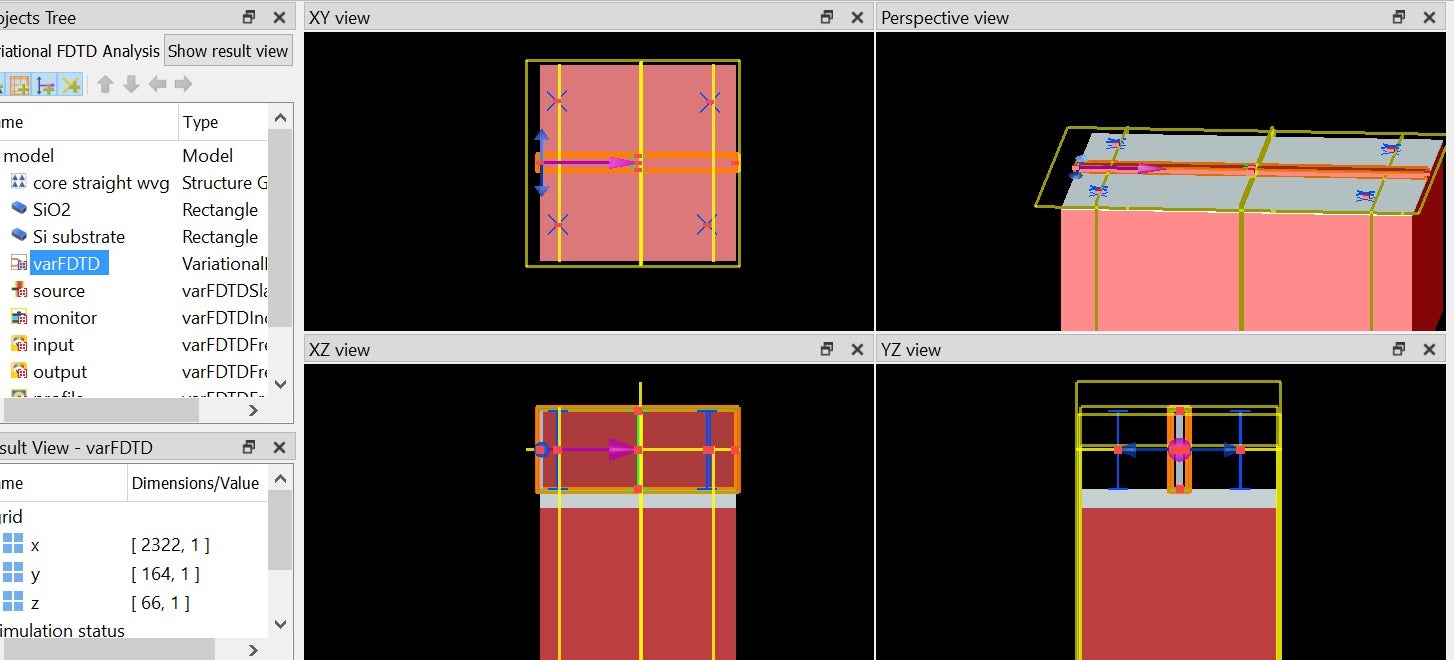
Also, I would like to ask, why is the transmission vs wavelength for a simple straight waveguide like that? From the image, left is input and right is output. Is this the expected transmission output?
Here are some parameters that i used for the simulation:
Substrate Silicon (Si) = 5.5 um thick | Silicon Dioxide (SiO2) = 4.5 um thick
core - SU8 = 4 um width, 4 um height
cladding - air
design size: 100 um x 100 um
-
February 21, 2023 at 8:44 pm
Amrita Pati
Ansys EmployeeHello,
I apologize for the late response. The quantities recorded by the monitor are in SI units by default. So, E is in V/m and T is unitless as it is the power transmitted through the monitor, normalized to the source power. More information on the units of different quanities can be found on the following page:
https://optics.ansys.com/hc/en-us/articles/360034397034-Units-and-normalization-conventions-in-Lumerical-solvers
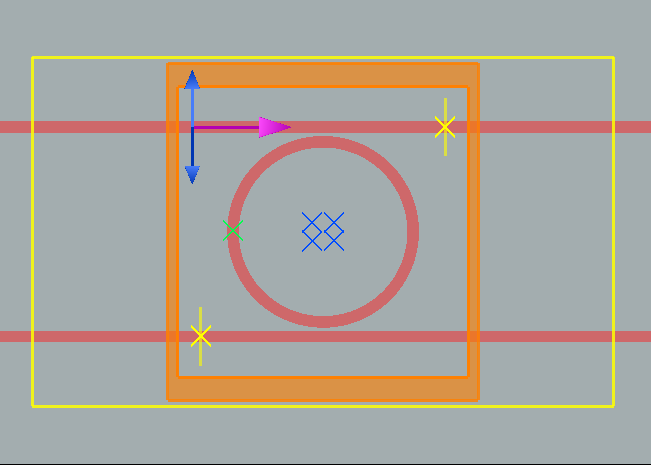
In the screenshots, I see that the structure ends within the simulation region. It is always recommended to extend the structure through the PML boundaries to avoid unnecesary reflections (please refer Always extend structures through PML boundary conditions). For example see the screenshot below for a ring resonator:
I would suggest you to extend the structure and rerun the simulation for more accurate results.
For SU8, I suppose you're loading index/permittivity data into the material database. I would also suggest that you check that the material fitting of all the materials (especially the uploaded data) are accurate in the Material Explorer.
Since this is a broadband simulation, make sure that you've selected "broadbad" in the effective index tab of varFDTD Simulation Bandwidth, shown below:
Thank you. -
February 22, 2023 at 3:52 am
azarulsani
SubscriberHi Amrita,
Thanks for the reply.
...T is unitless as it is the power transmitted through the monitor, normalized to the source power...
about this info, sometimes when i set the intensity power (amplitude) to 1, the Transmission graph will sometimes overshoot over 1.0. Is this normal and what could be the reasoning behind this?
-
February 22, 2023 at 4:33 pm
Amrita Pati
Ansys EmployeeTypically, this happens when the fields in the simulations haven't decayed sufficiently. I would suggest you to increase the simulation time and rerun the simulation to see if the problem still persists.
Thank you.
-
- The topic ‘Y axis unit for Lumerical MODE varFDTD output (E, T & etc)’ is closed to new replies.


-
4803
-
1582
-
1386
-
1242
-
1021

© 2026 Copyright ANSYS, Inc. All rights reserved.


