-
-
January 29, 2024 at 8:28 am
Vasanth
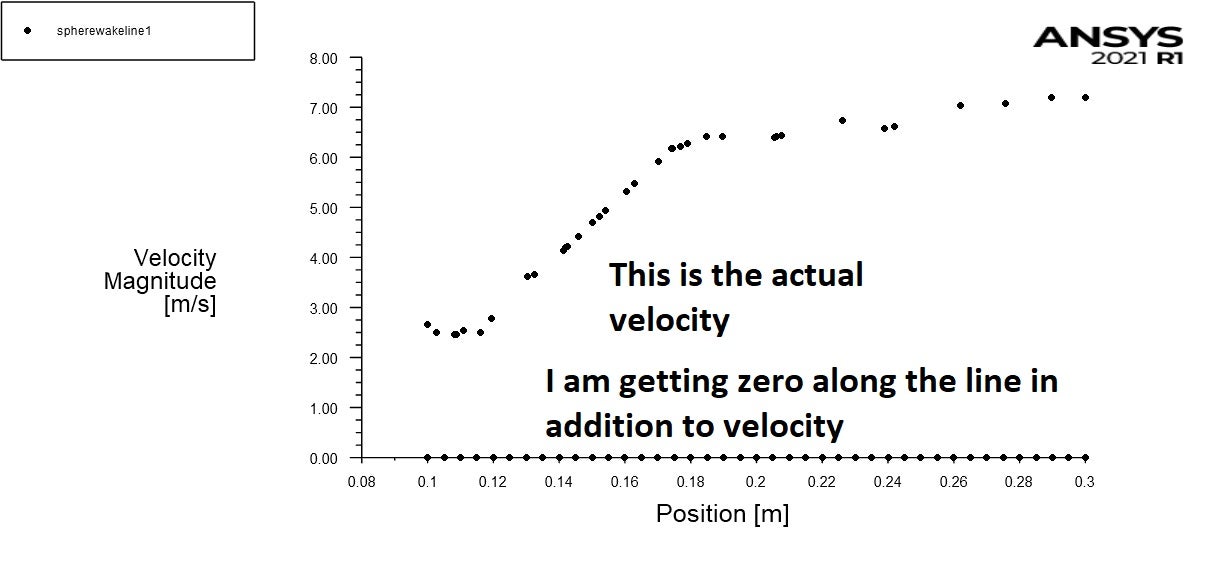
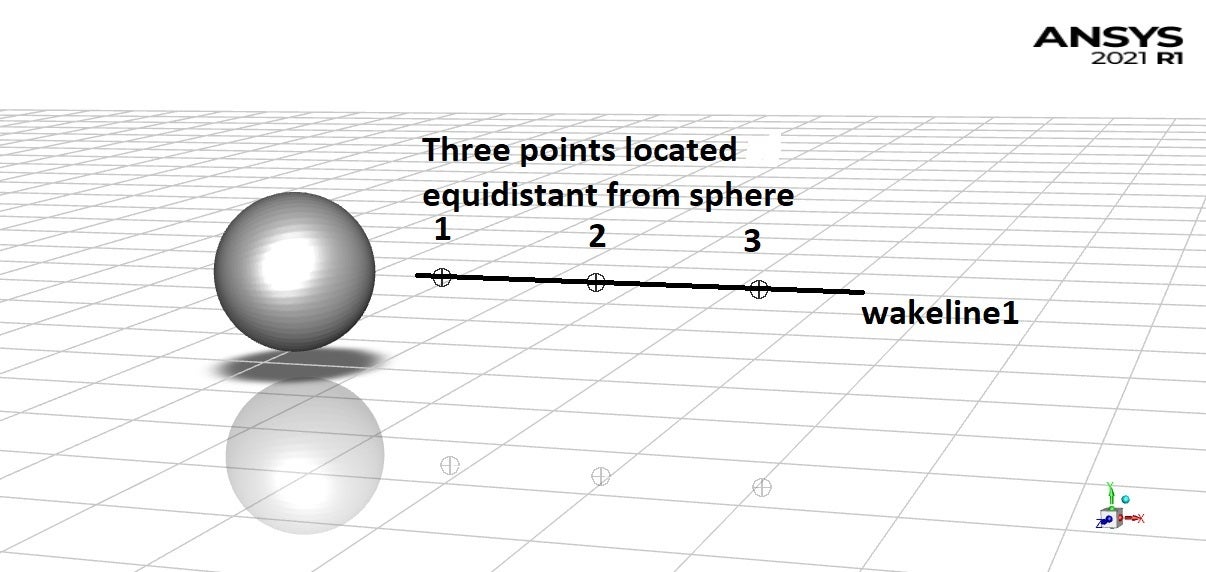
SubscriberI am trying to get strouhal number by plotting y-velocity magnitude behind an object. I created points at three different locations and I am getting results like this:
(title "Velocity Magnitude")
(labels "Position" "Velocity Magnitude")((xy/key/label "wakeline1")
0.1 0
0.104998 0
0.109998 0
0.114998 0
0.119999 0
0.124999 0
0.129999 0
0.134999 0
0.139999 0
0.144999 0
0.149999 0
0.154999 0
0.159999 0
0.164999 0
0.169999 0
0.174999 0
0.179999 0
0.184999 0
0.189999 0
0.194999 0
0.199999 0
0.204999 0
0.209999 0
0.214999 0
0.219999 0
0.224999 0
0.229999 0
0.234999 0
0.239999 0
0.244999 0
0.249999 0
0.254999 0
0.259999 0
0.264999 0
0.269999 0
0.274999 0
0.279999 0
0.284999 0
0.289999 0
0.294999 0
0.299999 0
0.3 6.91387
0.289745 6.89739
0.275614 6.89985
0.261968 6.60413
0.241968 6.28503
0.241951 6.28476
0.238961 6.25825
0.226175 6.02785
0.207596 5.36
0.206006 5.31931
0.20545 5.29859
0.189559 4.30707
0.184754 4.00728
0.178983 3.85005
0.176953 3.79477
0.174378 3.627
0.174184 3.61438
0.170158 3.46652
0.163056 3.26411
0.16039 3.18814
0.154233 2.971
0.152258 2.84069
0.150203 2.70513
0.145858 2.74018
0.142617 2.76632
0.142064 2.77622
0.141271 2.77394
0.132511 2.77776
0.13025 2.79407
0.119524 3.48827
0.116101 3.61393
0.110887 3.85565
0.108942 3.93972
0.108147 4.00168
0.102863 4.41364
0.1 4.34419
)Why are the values zero from 0-0.3 and then I am getting velocity from 0.3-0.1. It was not like this when I ran the simulation a few days back. Now I am not able to get the values of velocity from point as it is showing 0 even though the velocity is not zero. I am not sure if I was able to explain my point, please let me know if you need clarification. Any help is greatly appreciated. Thanks
-
January 29, 2024 at 3:50 pm
Rob
Forum ModeratorPlease can you post a contour plot overlaid with mesh so the lines are visible? I'm also wondering why the velocity isn't much lower near the ends of the line assuming there's a wall there.
-
January 29, 2024 at 5:49 pm
Vasanth
SubscriberHi
Thanks for taking time to reply. Its not the boundary layer. The velocity values look okay and the drag is about 0.4 which is in accordance with literature for flow past sphere. The vertex average at the points have zero velocity as shown in figure. Even the line has zero velocity along the line and then there is some velocity of wake. Why the velocity is zero? I used Hex Mesh for "Body of Influence". Is this messing up with the results?
I hope the images convey my question. Please let me know where I am possibly going wrong. Each simulation is taking hours to complete and I am not able to get the strouhal number.
Thanks!
-
-
January 29, 2024 at 5:53 pm
Rob
Forum ModeratorPlease can you post the settings you're using for the plot? Ie screen grab of the panel.
-
January 29, 2024 at 8:17 pm
-
January 30, 2024 at 11:37 am
Rob
Forum ModeratorThat's odd. The line shouldn't return two values unless it's in two places, what is the line definition?
-
February 28, 2024 at 6:18 pm
Vasanth
SubscriberHi sir. Unfortunately, I was not able to correct the mistake. Some problem with meshing or body of influence definition. I shifted to ICEM mesh and it is working now. Thanks for taking time to reply.
-
February 29, 2024 at 11:36 am
Rob
Forum ModeratorAh, you'd managed to import overlapping mesh. ICEM CFD meshing has it's place, but I'd not use it over Fluent Meshing unless you REALLY need full hex, which you don't.
-
February 29, 2024 at 11:59 am
Vasanth
SubscriberI had tried ansys meshing. Mesh is good with low wall y+ and mean skewness was less than 20. In spite of that, I failed to get drag coefficient for sphere reported in literature. Standard RANS was not much use for flow past sphere and had to use DES with SST K-omega. I was doing something wrong each time. With new mesh, I am gettting drag coefficient reported in literature with DES model but have to see if pressure coefficient is matching. Thanks for your comments- I will try with Fluent Meshing if this fails.
-
- The topic ‘XY plot in Ansys fluent 2021 R1’ is closed to new replies.


-
4838
-
1587
-
1386
-
1242
-
1021

© 2026 Copyright ANSYS, Inc. All rights reserved.


