TAGGED: #fluent-#cfd-#ansys, cfd-post, fluent-cfd-post, postprocessing
-
-
October 25, 2022 at 4:23 pm
Smeet
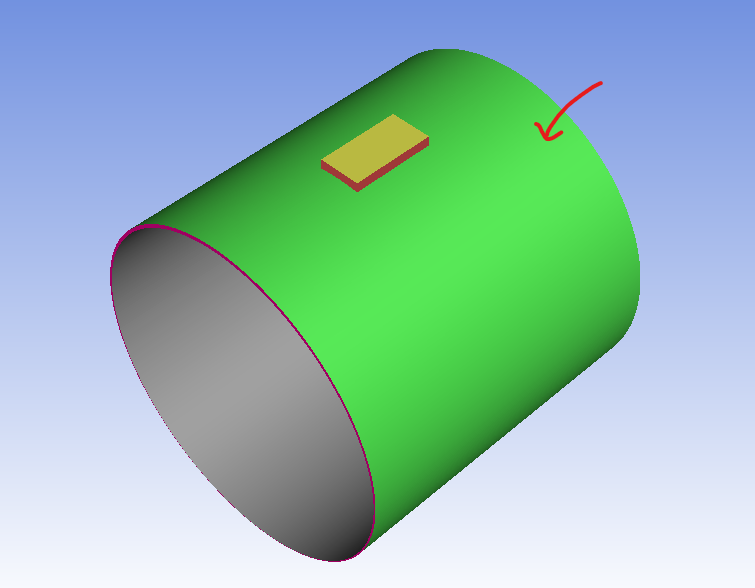
SubscriberHi, I am trying to make a xy plot of pressure on outer surface of this fluid element, but trying to make a plot in curve direction always gives me an error, which I have attached below. After some research I understood, we cannot plot on closed curves, so what is the way to plot that?? Its really important for my project and I need it urgently. Is there some way to do that in cfd post too??
-
October 26, 2022 at 10:59 am
Rob
Forum ModeratorI can’t see the second image, but as a guess you’re stuggling to create the line? If you create an isosurface of constant x, y or z AND select the outer mesh face when you press Create you’ll get a surface (possibly 2 in this case as it’s a annular channel) of the intersect of the isosurface and mesh surface. You may not be able to plot length, but will be able to plot position for that approach.
-
October 26, 2022 at 11:48 am
Smeet
SubscriberBut I want to plot along curve length,
Basically, I want to plot a spline/line along the circumference of the green face in the first image. -
October 26, 2022 at 2:38 pm
Rob
Forum ModeratorI don't think you can in Fluent. The surface is curved so you'll not get a line onto it: the "surface" option has no length, only a position. You can create Custom Field Functions to get a value from 0 to length of the line. I generally use Excel for the graphs so adjust the x-axis to suit.
-
October 27, 2022 at 5:35 pm
Smeet
SubscriberThanks for the help Rob.
I figured out another way (for anyone looking for something similar):
1. Open CFD post and make a plane (from locations option) normal to your curve (z-axis is the normal in my case here)
2. Open the polyline option and select boundary intersection method, in 'boundary list' select the surface of your interest (on which you want to plot your variable); in 'intersect with' select that plane.
3.Click Apply and this creates the polyline.
4. Now open the chart option and in data series tab select polyline for location, in x axis tab select 'curve length of polyline x' and in y axis tab select the variable of your interest. Click apply and there is your plot. You can also export it to Excel or any spreadsheet software for further post processing.Hopefully this is the plot you were looking for.
-
- The topic ‘xy plot along curve length’ is closed to new replies.


- air flow in and out of computer case
- Varying Bond model parameters to mimic soil particle cohesion/stiction
- Eroded Mass due to Erosion of Soil Particles by Fluids
- I am doing a corona simulation. But particles are not spreading.
- Centrifugal Fan Analysis for Determination of Characteristic Curve
- Guidance needed for Conjugate Heat Transfer Analysis for a 3s3p Li-ion Battery
- Issue to compile a UDF in ANSYS Fluent
- JACOBI Convergence Issue in ANSYS AQWA
- affinity not set
- Resuming SAG Mill Simulation with New Particle Batch in Rocky

-
4102
-
1487
-
1318
-
1156
-
1021

© 2025 Copyright ANSYS, Inc. All rights reserved.


