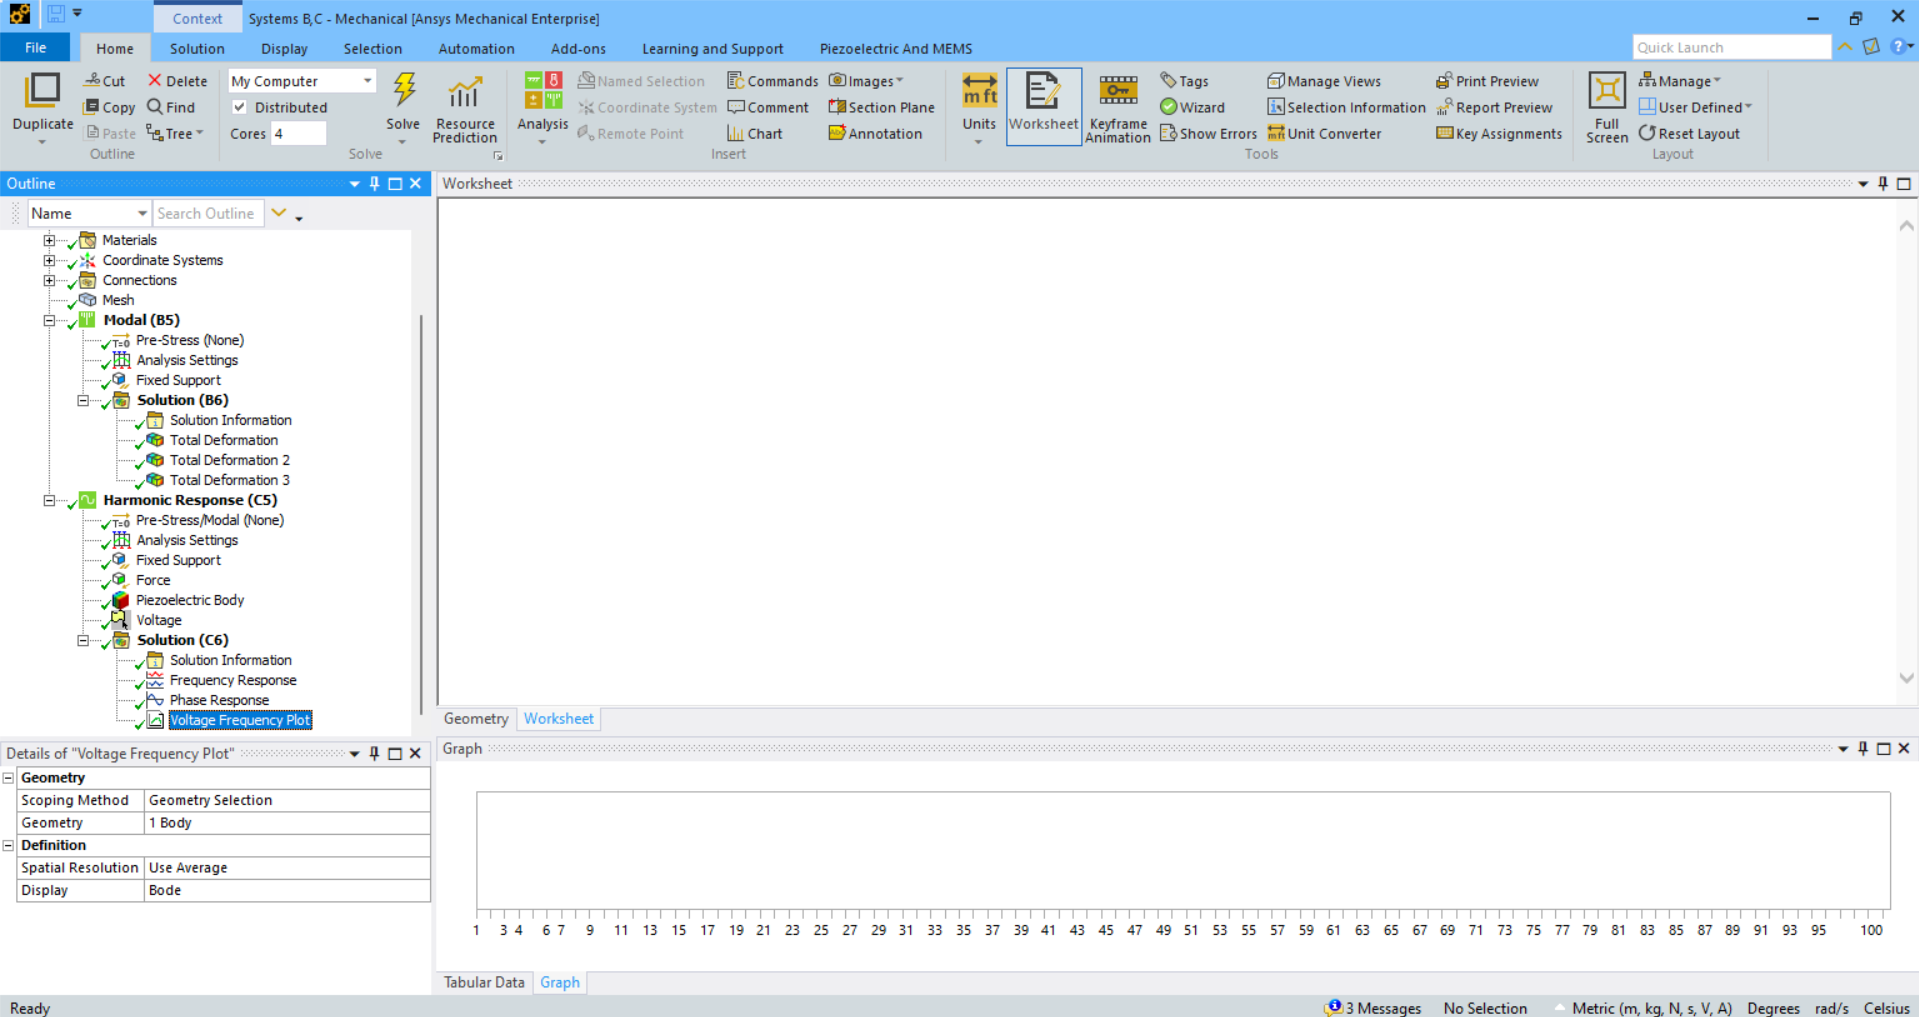
Worksheet Not Showing Voltage Frequency Plot


Viewing 7 reply threads
- The topic ‘Worksheet Not Showing Voltage Frequency Plot’ is closed to new replies.


