TAGGED: Converge, fluent, mass-flow-rate, monitor, residual
-
-
February 22, 2023 at 3:42 am
Milne Ando
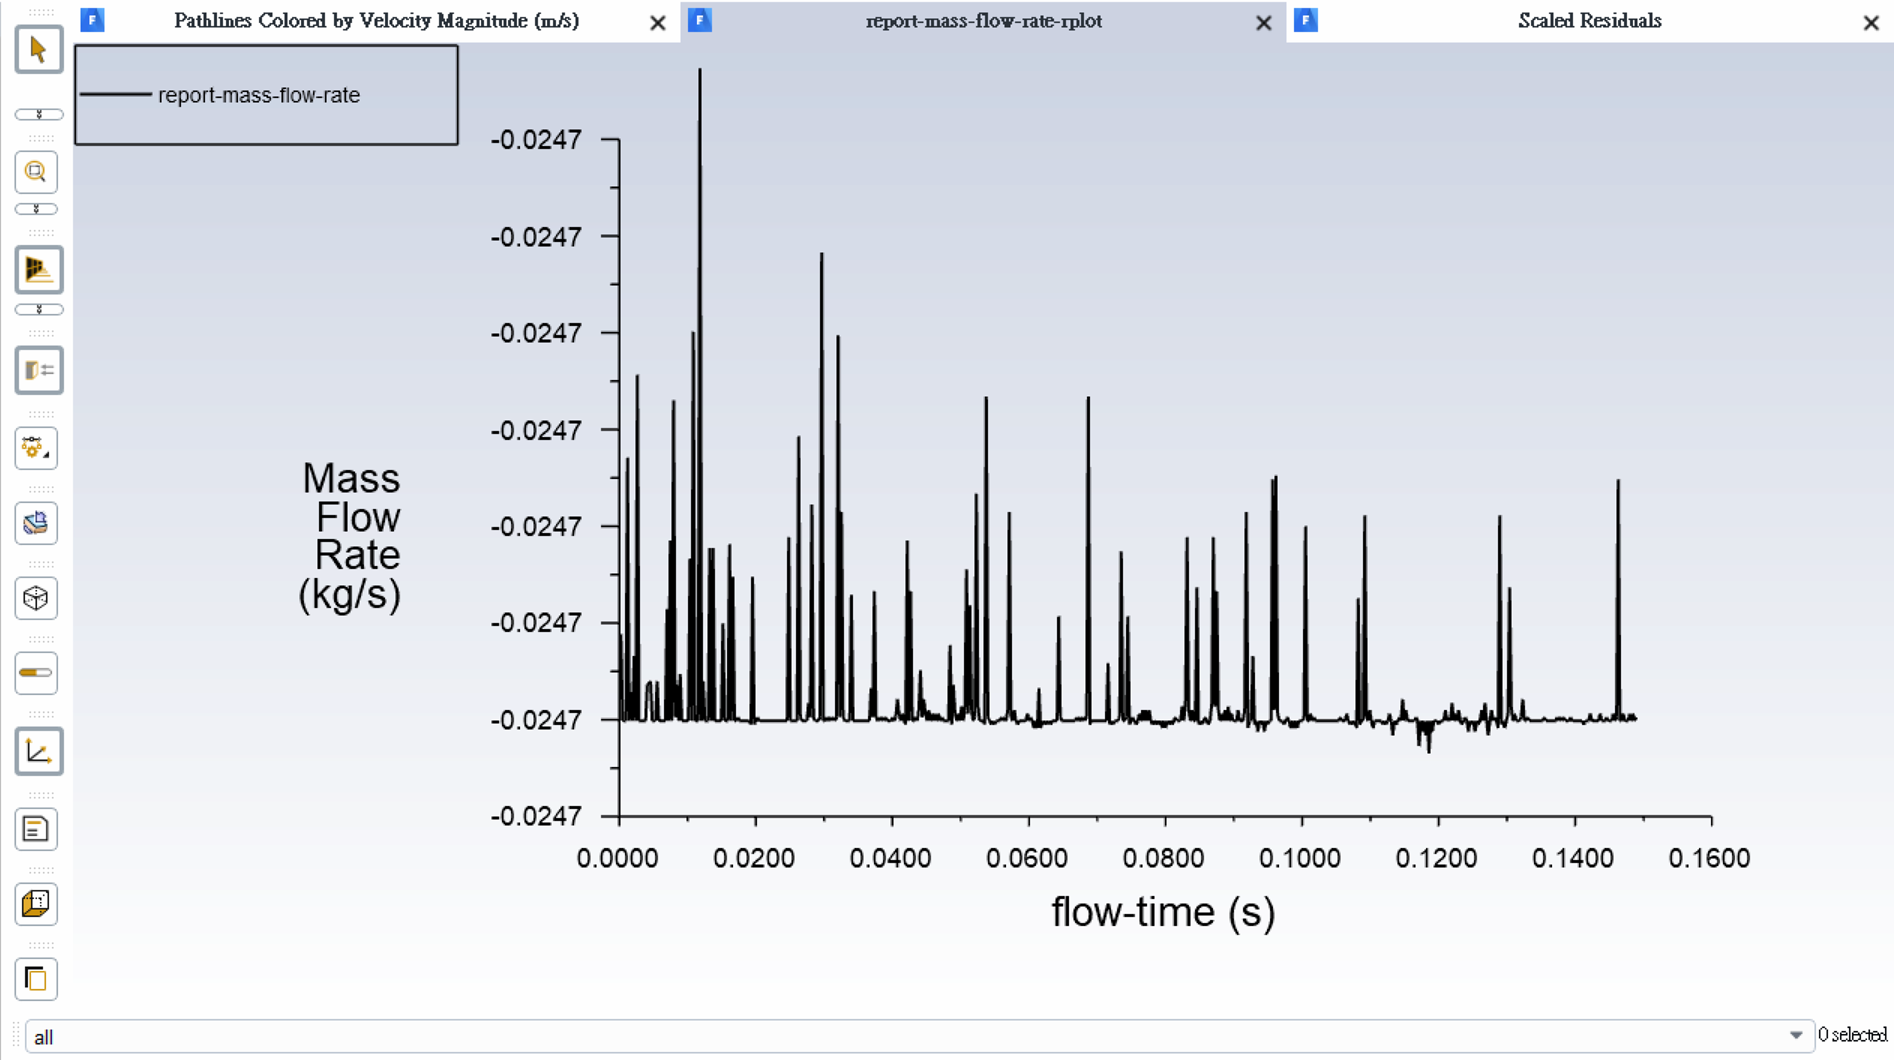
SubscriberI'm still working on simulating the 3D FSI problem, and I recorded the outflow of my wind tunnel model. As the pic shows, the mass flow rate kept the same value of -0.0247, but its plot didn't give a horizontal line. Uh, I don't understand what was wrong.
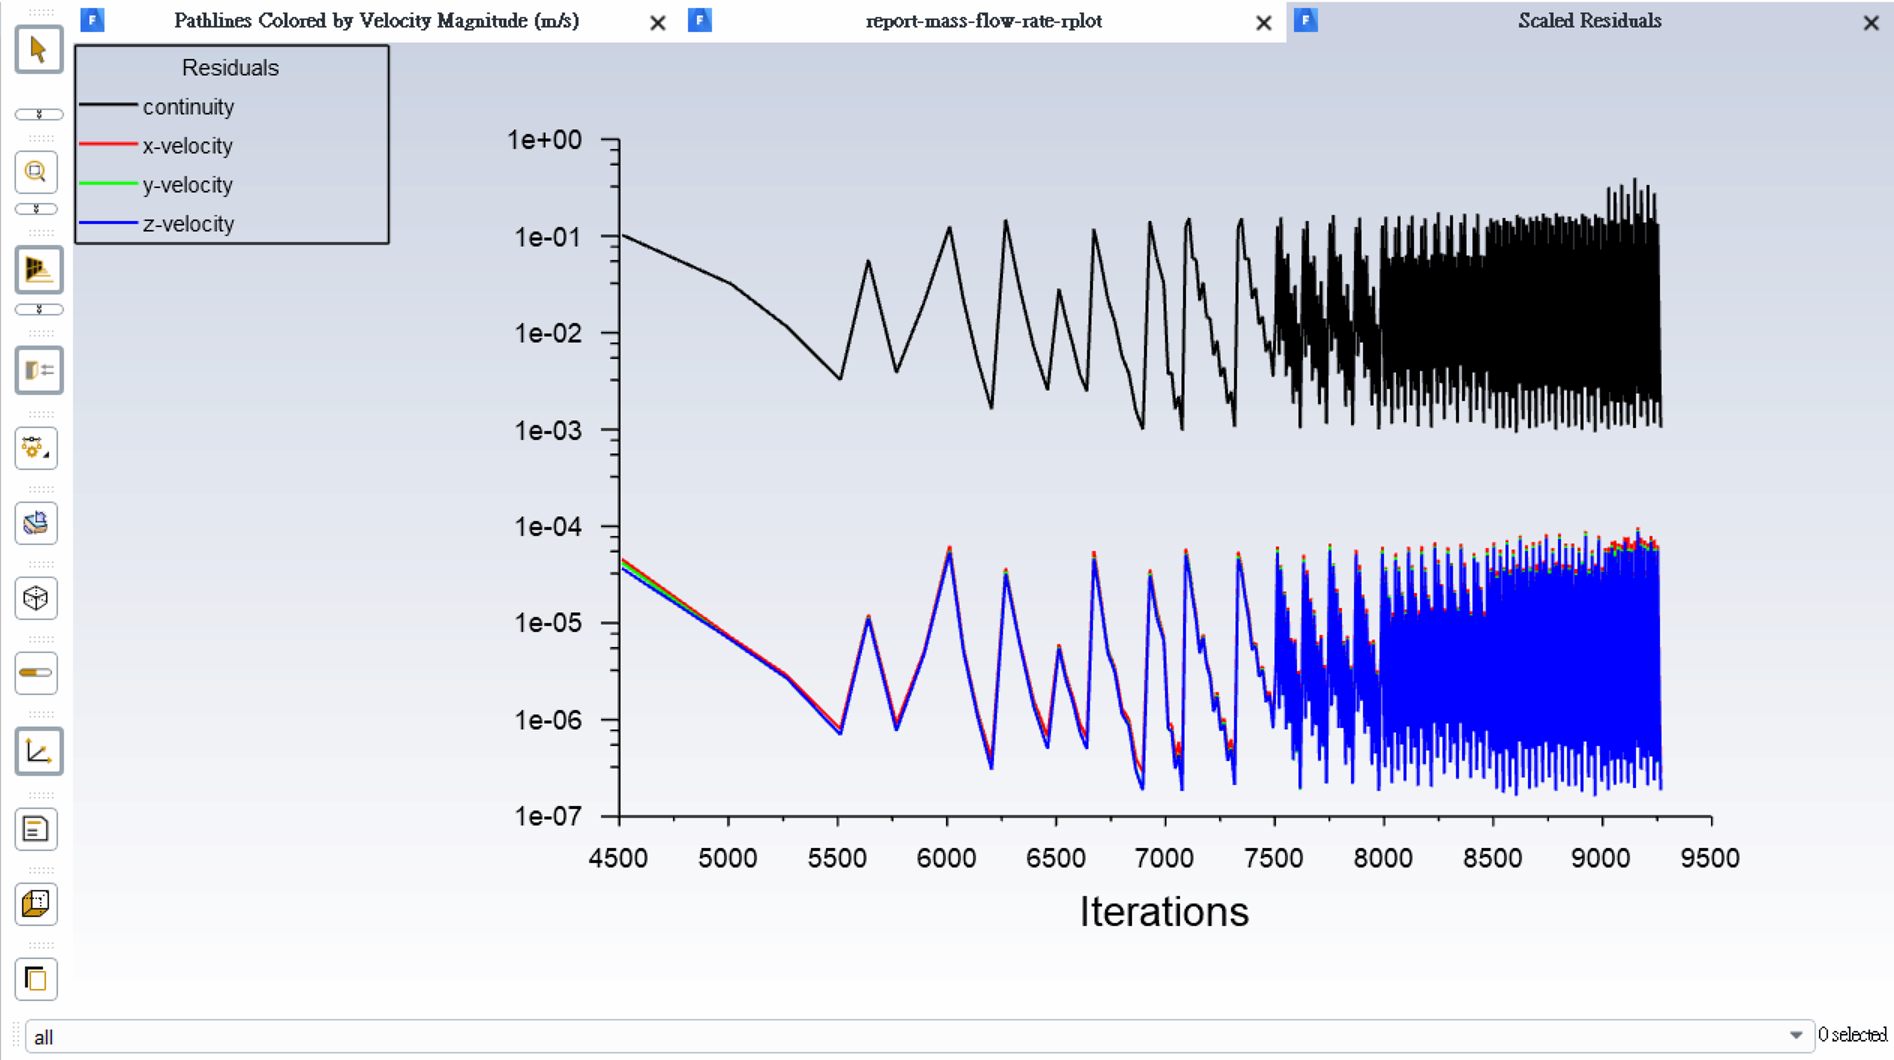
another question is, the plot only shows iterations after no.4500, how can I check the iterations before no.4500, namely, make them show up?
-
February 22, 2023 at 9:56 am
Nikhil N
SubscriberHello!
To address both of your questions, we can adjust the range of the axes. This will allow you to manipulate the display of the data and potentially bring out patterns or details that were not apparent before.Thanks!
Nikhil
-
February 24, 2023 at 5:09 am
Milne Ando
Subscriberhi,
I got it. I checked "per zone" box to show the mass flow rate of inlet and outflow, and both are horizontal lines. That's right. And I still has 2 qusetions:
- I right clicked the "residual" and checked the setting panel, but I still don't know how I can do to show iterations from 1 the last one.
- I need to import the motion history of moving object into Excel or Matlab, but its format (.6dof) can't be opened. How can I do?
I look forward to your reply. Thank you!
Milne
-
-
February 27, 2023 at 2:02 pm
Essence
Ansys EmployeeHello,
To answer your first question, in "Residuals" tab, incerase the number of iterations to plot and to store to the desired number. For the second question, right click the .6dof file and click "Open with". In the drop down options, choose the notepad, where the data points are visible. Save the file in the notepad and import the notepad file in whichever software you want. Let me know if this helps.
-
February 28, 2023 at 9:37 am
Milne Ando
SubscriberHello,
I opened it successfully, but it only showed CG location, time and orientation. How can I get velocity data recorded? I need to import them into excel.
Looking forward to your reply. Thank you!
-
-
March 2, 2023 at 8:04 am
Essence
Ansys EmployeeHello,
Try using "Data sampling" statistics. You can refer here for more info: 46.16. Run Calculation Task Page (ansys.com) 3.23. Setting Data File Quantities (ansys.com) 33.13. Performing Time-Dependent Calculations (ansys.com)
-
- The topic ‘Why mass flow rate keeps same value but looks oscillating irregularly in monitor’ is closed to new replies.


-
4723
-
1565
-
1386
-
1242
-
1021

© 2026 Copyright ANSYS, Inc. All rights reserved.


