-
-
October 18, 2021 at 9:17 pm
Amirmkr
SubscriberConsidering the following macro that is a static problem:
/PREP7
ET,1,BEAM188
MPTEMP,,,,,,,,
MPTEMP,1,0
MPDATA,EX,1,,2.068e11
MPDATA,PRXY,1,,0.3
SECTYPE, 1, BEAM, CTUBE, , 0
SECOFFSET, CENT
SECDATA,0.055,0.065,4,0,0,0,0,0,0,0,0,0
K, ,0,0,0,
K, ,0.8,0.125,0,
K, ,1.25,0.3,0,
LSTR, 1, 2
LSTR, 2, 3
LESIZE,ALL, , ,10, ,1, , ,1,
FLST,2,2,4,ORDE,2
FITEM,2,1
FITEM,2,-2
LMESH,P51X
FINISH
/SOL
ANTYPE,0
FLST,2,1,3,ORDE,1
FITEM,2,1
/GO
DK,P51X, ,0, ,0,UX,UY,UZ,ROTX,ROTY, ,
NSEL,S, , , 12
DSYM,SYMM,Y, ,
FLST,2,1,3,ORDE,1
FITEM,2,3
/GO
FK,P51X,FX,-5000
ALLSEL,ALL
/STATUS,SOLU
SOLVE
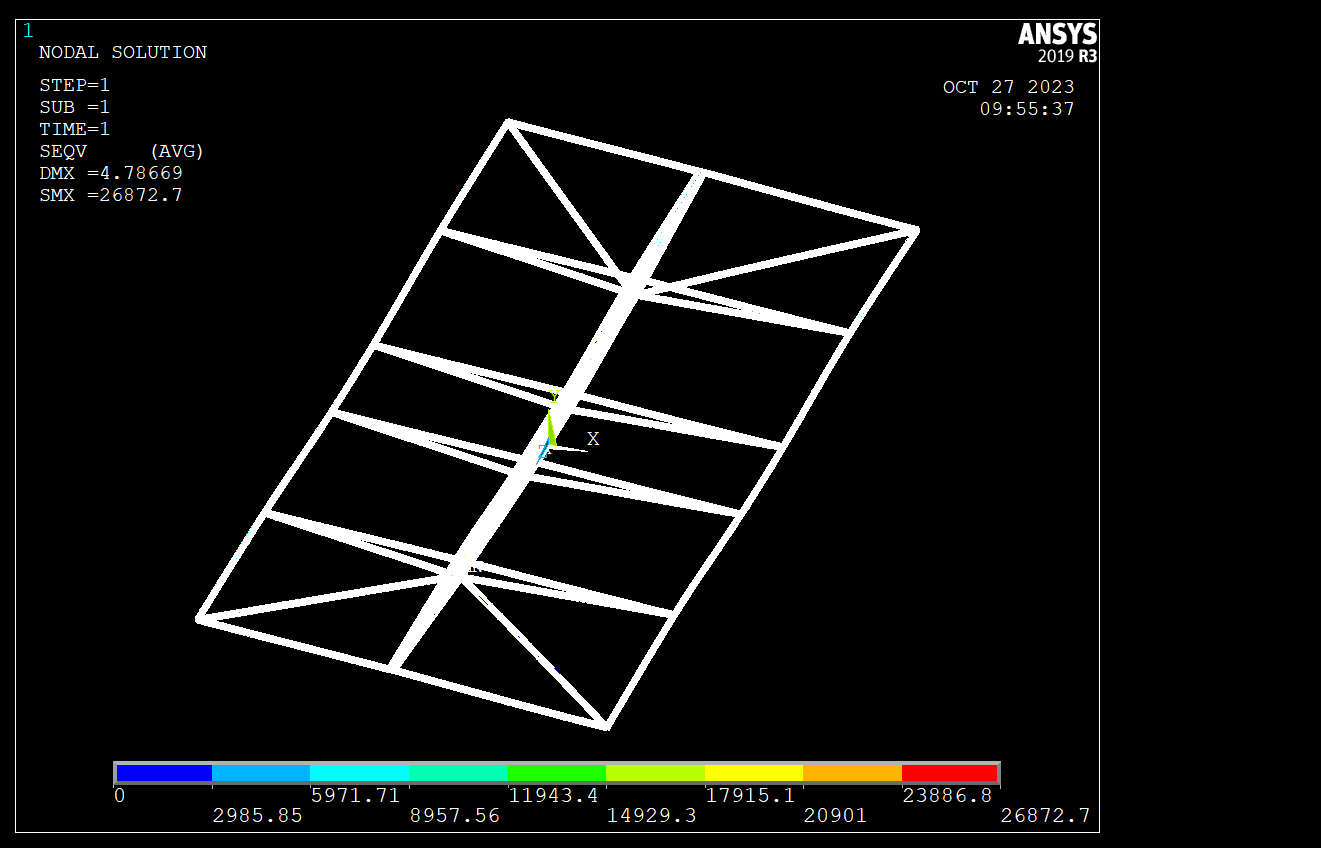
When I want to plot the stress plots, it just gives the deformed geometry, all in red color. Why is that?
October 19, 2021 at 8:43 amErKo
Ansys Employee
Stress results in beam elements are typically on the cross section so we need to show that cross section in our window - to do that issue
/ESHAPE,1
Then do
set,last,last
plnsol,s,eqv ! VM stress
See eshape command in help for more info.
All the best
Erik
-
October 27, 2023 at 1:57 am
October 19, 2021 at 11:15 pmAmirmkr
SubscriberThanks a lot Erik, that solved the problem, but why does the problem in the following link not need such procedure on cross section for stress plot?
https://www.youtube.com/watch?v=1dvEmK6To7M
Viewing 2 reply threads- The topic ‘Why does the solved problem not give the stress contour plots?’ is closed to new replies.
Innovation SpaceTrending discussionsTop Contributors-
4763
-
1565
-
1386
-
1242
-
1021
Top Rated Tags© 2026 Copyright ANSYS, Inc. All rights reserved.
Ansys does not support the usage of unauthorized Ansys software. Please visit www.ansys.com to obtain an official distribution.
-


Ansys Assistant

Welcome to Ansys Assistant!
An AI-based virtual assistant for active Ansys Academic Customers. Please login using your university issued email address.
Hey there, you are quite inquisitive! You have hit your hourly question limit. Please retry after '10' minutes. For questions, please reach out to ansyslearn@ansys.com.
RETRY


