-
-
April 29, 2024 at 12:17 pm
Simon Lejon
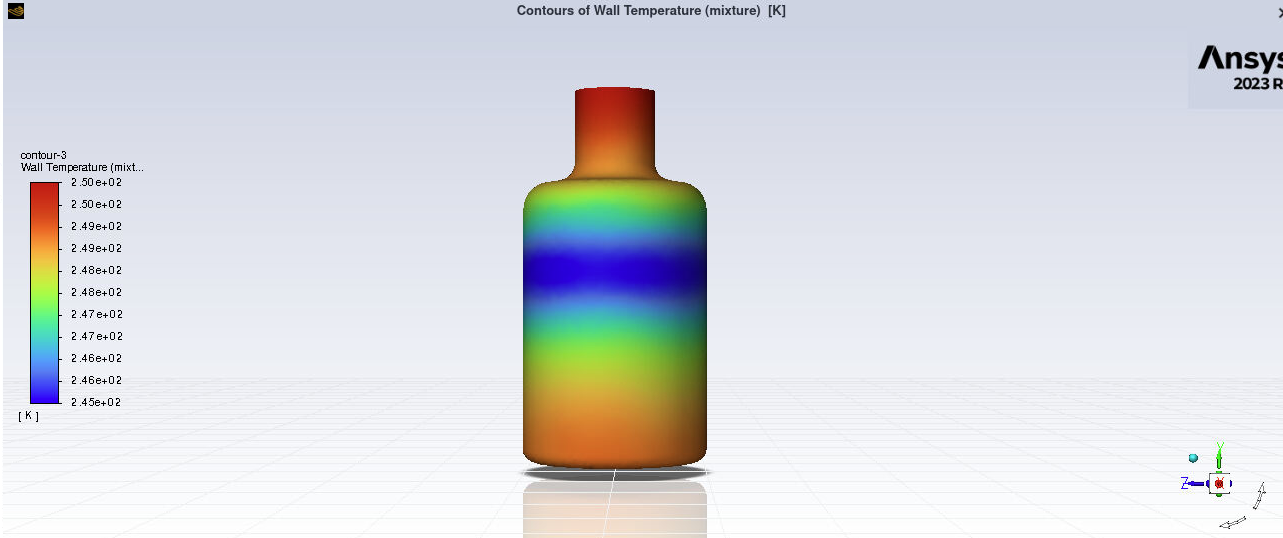
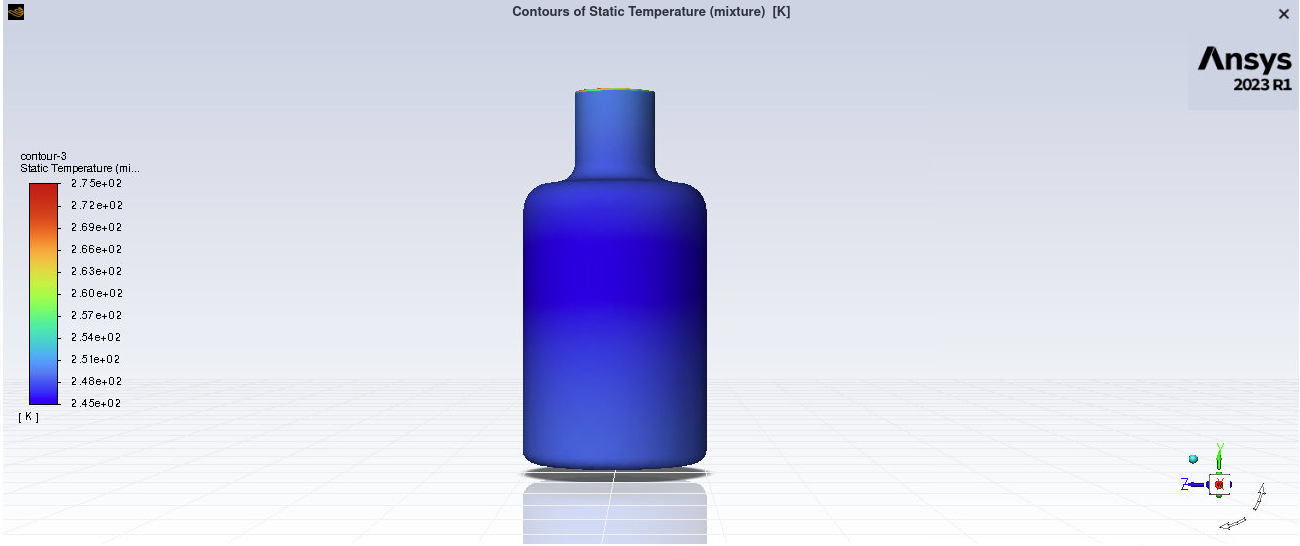
SubscriberI implemented a vial wall temperature boundary condition to a steady state simulation that modeled the flow within a rotating vial. As expected, the water formed a thin layer on the vertical wall of the vial since the rotatinal velocity magnitude is 3000 rpm (picture 3). Now turning off the flow and volume fraction equation, and turning on the energy equation, and introducing the temperature wall boundary condition. In attachement (picture 1), you see the wall temperature (as I expected). But now, if I plot the static temperature of the vial wall (picture 2), it is completely uniform. I don't know why the static temperature of the wall is uniform while the wall temperature is much lower in the middle of the vial.
As second question: If I run the temperature simulation transient, I get a YZ-plane static temperature plot that looks as in attachment (picture 4) (after 0.6 sec). I don't understand why the temperature in the middel of the vial (air region) is much higher than the adjacent air layer. The air layer a bit closer to the water layer is 245 K and and air in the middle of the vial is 300 K, which is a really big difference. How is this possible?
(((In the last picture, the headspace region is also shown. This is defined as a pressure outlet and also used as the operating pressure location (101325Pa) (a bit higher than the vial itself)))) -
April 29, 2024 at 1:33 pm
Rob
Forum ModeratorWall temperature and static temperature aren't the same, check the definitions in the manual https://ansyshelp.ansys.com/account/Secured?returnurl=/Views/Secured/corp/v222/en/flu_ug/flu_ug_fvdefs.html
The last image suggests that you need to check the pressure boundary reverse flow temperature.
-
- The topic ‘Vial temperature simulation’ is closed to new replies.


-
5094
-
1831
-
1387
-
1248
-
1021

© 2026 Copyright ANSYS, Inc. All rights reserved.


