TAGGED: c-d-nozzle, Supersonic-Nozzle-Flow, total-pressure
-
-
November 8, 2024 at 10:05 am
am.23me1105
SubscriberI have simulated a Supersonic Jet Flow - Convergent-Divergent nozzle
First, the geometry was used without settling chamber but after analyzing the pressure plot a settling chamber was introduced to match exactly as experiment but still the total pressure plot is wrong.
1). Boundary conditions used are as follows:
Settling Chamber Inlet: Pressure Inlet, Total Pressure= 253312.5 Pa & Initial Gauge Pressure = 233312.5 Pa, Total Temp = 300K
Far-Field Boundary: Pressure Far-Field, Gauge Pressure = 0, Mach = 0.01
Outlet: Pressure Outlet, Gauge Pressure = 0, Backflow Pressure = Total Pressure
Operating Pressure = 101325 Pa
2). Another simulation has been done and boundary conditions used are as follows:
Settling Chamber Inlet: Pressure Inlet, Total Pressure= 253312.5 Pa & Initial Gauge Pressure = 0 Pa, Total Temp = 300K
Far-Field Boundary: Pressure Far-Field, Gauge Pressure = 0, Mach = 0.01
Outlet: Pressure Outlet, Gauge Pressure = 0, Backflow Pressure = Total Pressure
Operating Pressure = 101325 Pa
3). Another simulation has been done using these Boundary conditions:
Settling Chamber Inlet: Pressure Inlet, Total Pressure= 253312.5 Pa & Initial Gauge Pressure = 250312.5 Pa, Total Temp = 300K
Far-Field Boundary: Pressure Far-Field, Gauge Pressure = 0, Mach = 0.01
Outlet: Pressure Outlet, Gauge Pressure = 0, Backflow Pressure = Total Pressure
Operating Pressure = 101325 Pa
Note: Density-Based Steady Solver, SST-kw Model with Low Reynolds Correction, Implicit Formulation, Roe-FDS Flux type and LSCB & Second order Upwind discretization method was adopted.
Mesh Element: Firstly, 300000 mesh elements were taken but after not getting satisfactory results, number of mesh element was increased 2 to 3 times. In the last simulation, mesh element was about 17Lakhs (1.7M). Fine mesh element (10^-6 m) distributed in near wall region.
Pseudo Time Method = off : Hybrid Initialization Method adopted
Solution Steering = On, Used FMG Initialization, Courant Number= 1 to 5
Please help me and suggest what is wrong here in my simulation and boundary condition.
Please also suggest the correct boundary condition Parameters for NPR = 2.5, 4 & 6
-
November 27, 2024 at 2:13 pm
Essence
Ansys EmployeeHello,
Are you simulating a steady or transient case? Could you please share screenshot of the contour plot for total pressure?
-
November 27, 2024 at 3:55 pm
am.23me1105
SubscriberRespected sir,
The attached results and plots are STEADY state results, but I have run a Transient simulation which is not converging.
The transient simulation is not yet complete, but the results and total pressure plot look like they follow the same pattern up to the point simulated so far.
Total pressure contour of STEADY case attached herewith.
Thanking you sir.
-
November 28, 2024 at 2:27 pm
Essence
Ansys EmployeeI see. Why are you using three BCs: pressure inlet, pressure farfield and pressure outlet? I believe you need to use only two of them. And use Standard intialization instead of hybrid for FMG initialization. I see the maximum Pt is 2.5 bar. What is the expected value?
-
November 28, 2024 at 3:14 pm
am.23me1105
SubscriberRespected Sir,
I am very much thankful to you for your kind valuable suggestion.
I will do a simulation with Two Boundary condition using Pressure outlet in place of pressure far field and Standard initialization then I'll make you updated.
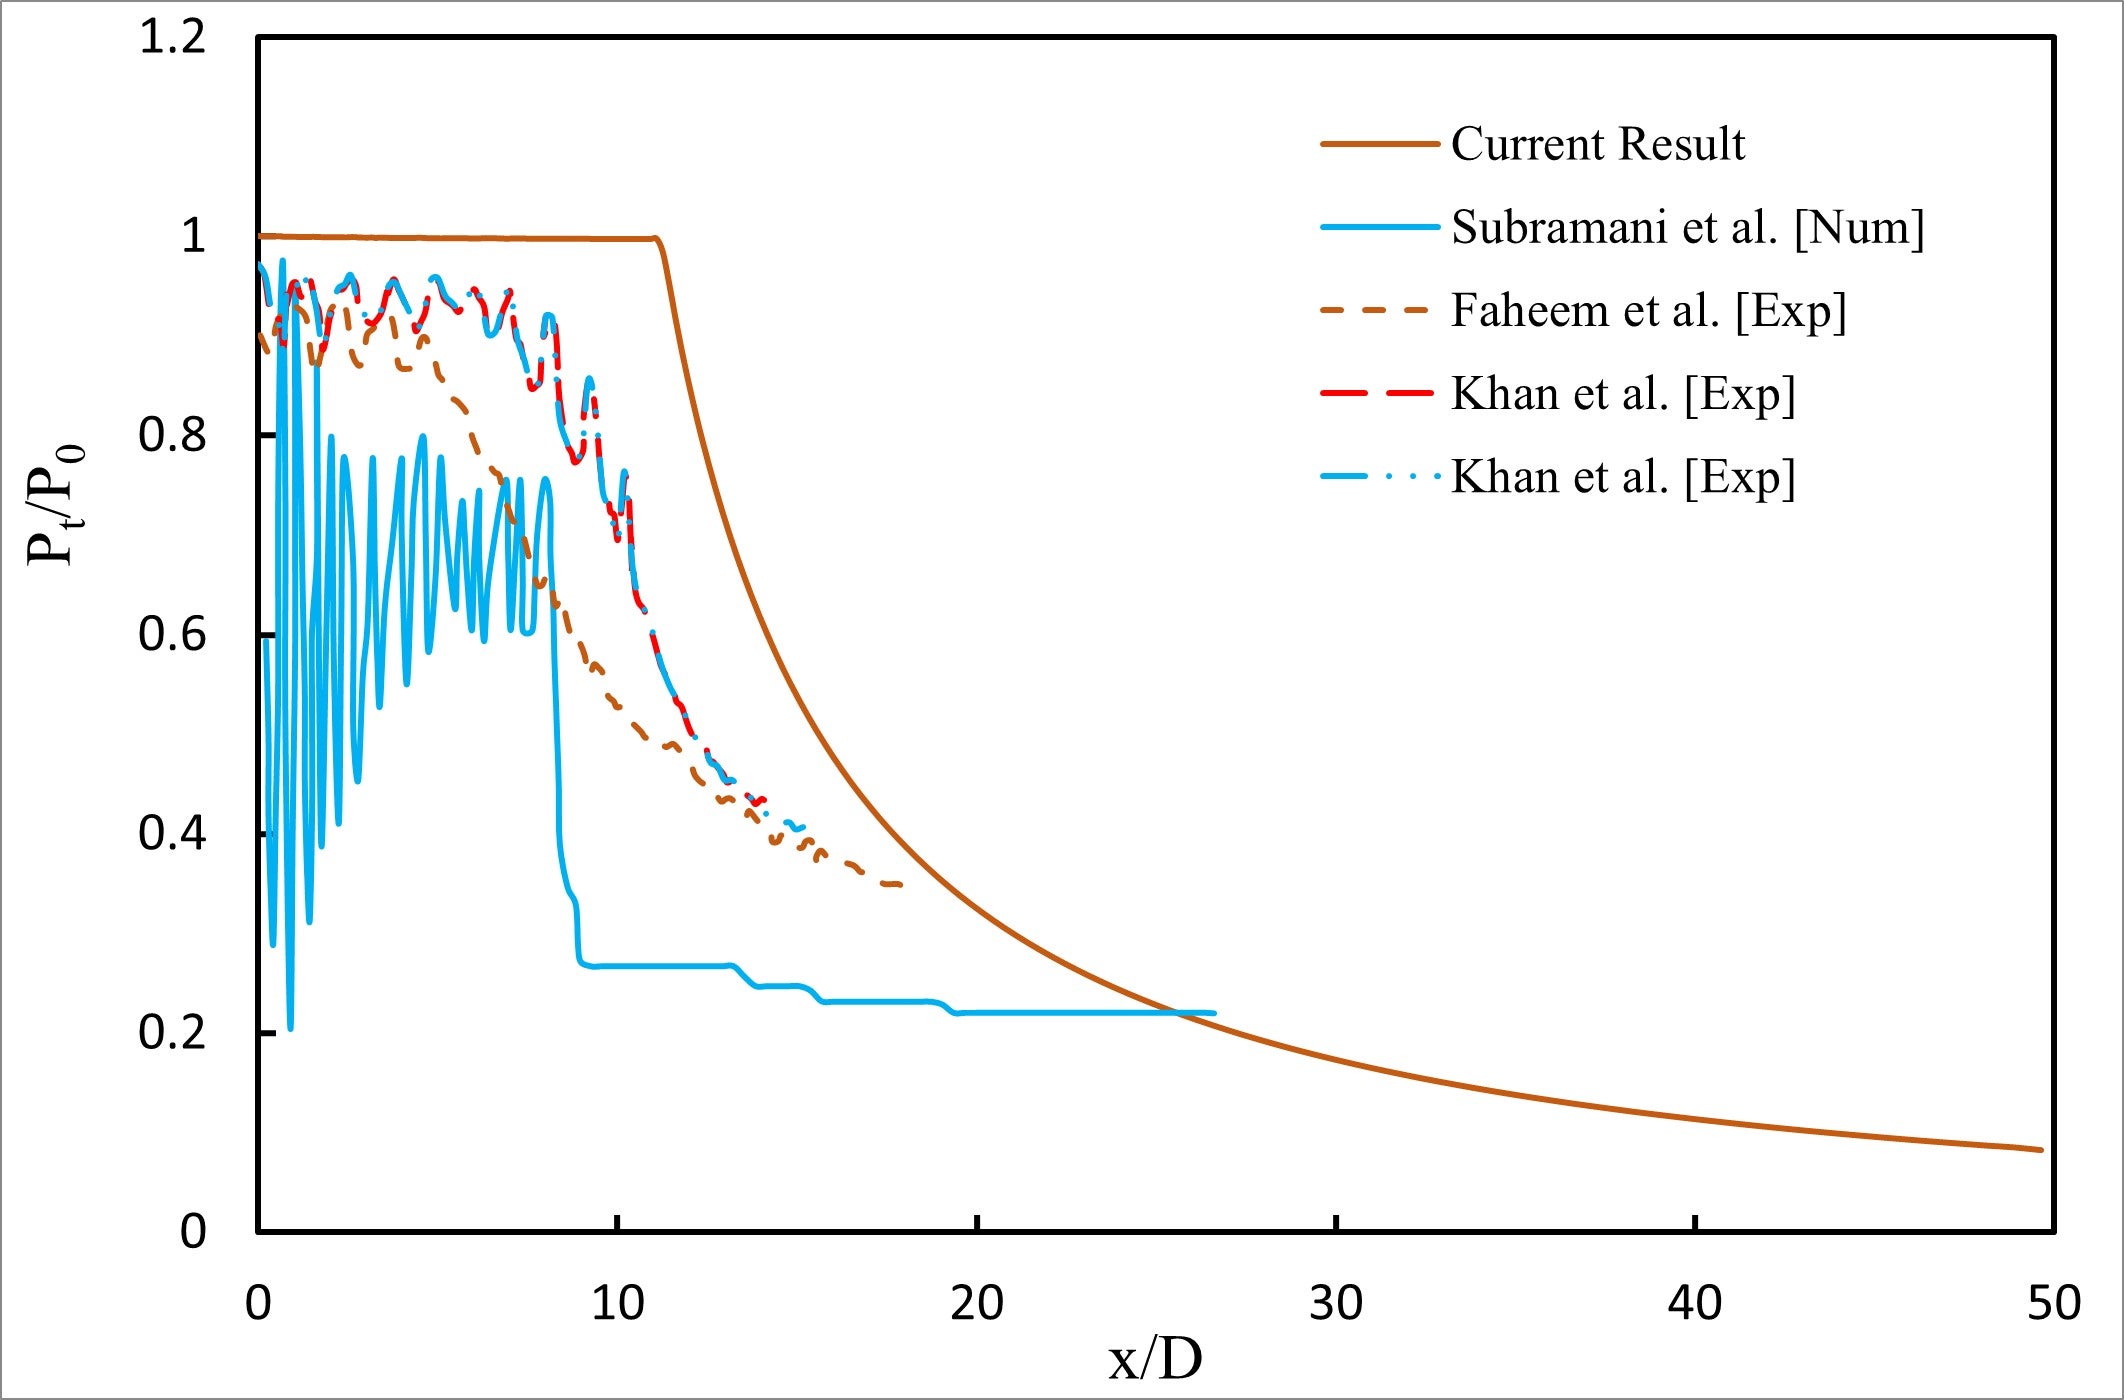
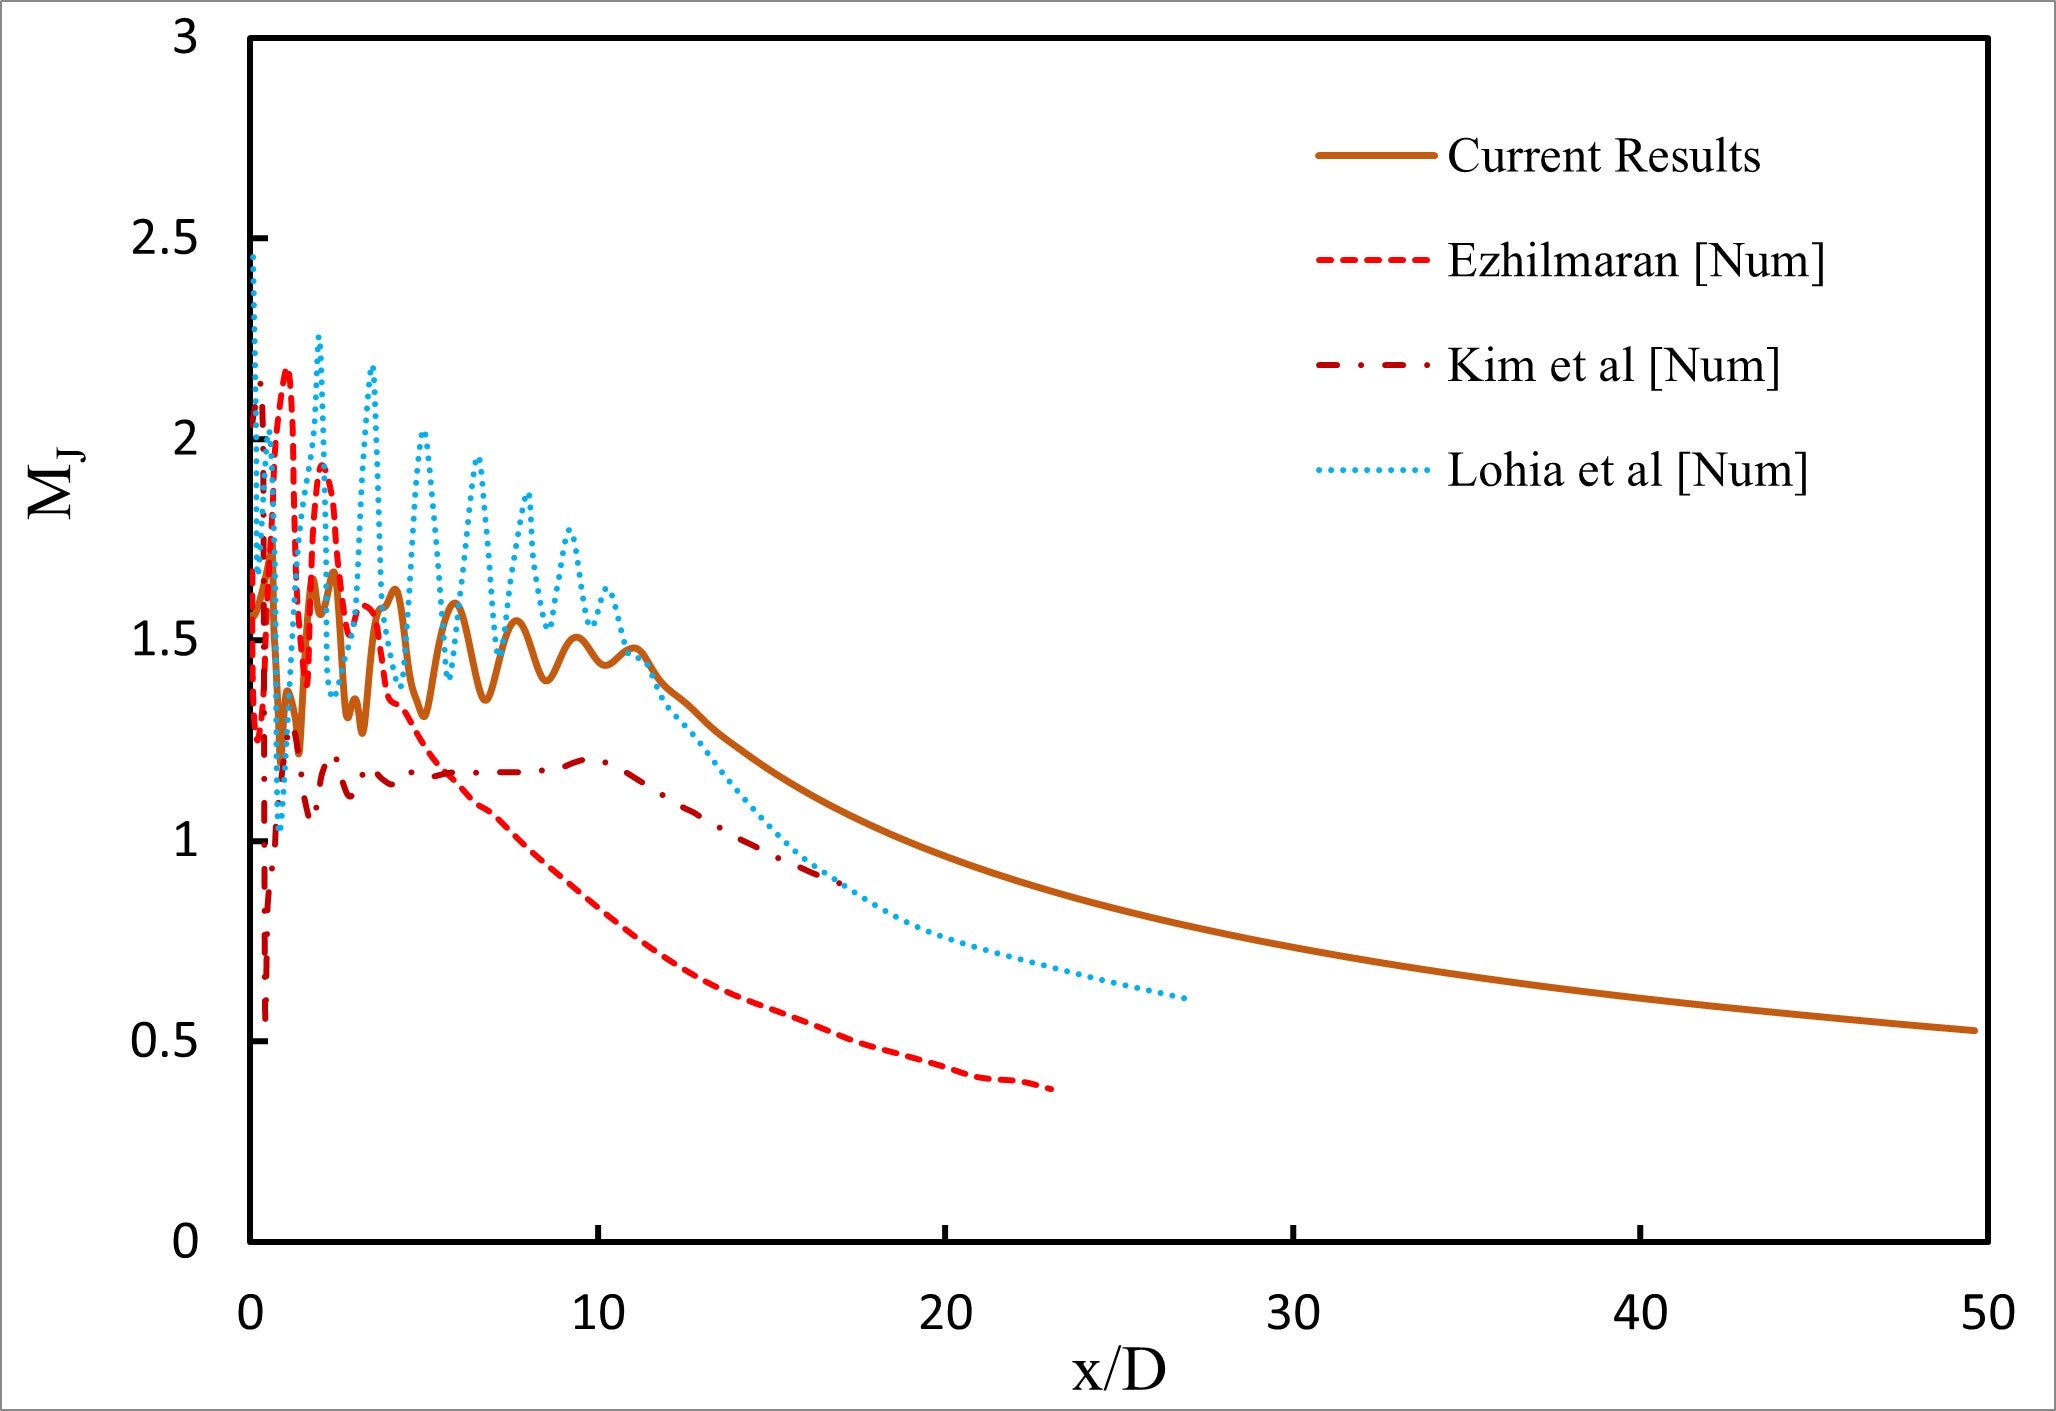
Expected value for pressure is 2.5 bar is okay but concern is with flat line plot of total pressure in near field region, whether suppose to have rapid oscillation in near field region. From the published data I have attached earlier, you can see the pressure decay characteristics.
Again I am very much thankful to you.
-
November 28, 2024 at 4:59 pm
Essence
Ansys EmployeeIf you observe the published graph data of pressure which has pressure decay characteristics, please see that it has been non-dimensionalized. That is, it has Y axis of Pt/Po and not just the Pt as seen in the Fluent graph which is in Pascals. I don't know what is at the X axis in published data, since the lower part of the image been cut off a bit. In published data, it is intervals of 5 units whereas in Fluent, it is 0.1 m interval. Isn't it?
-
November 28, 2024 at 5:10 pm
am.23me1105
SubscriberRespected Sir,
P0 is a constant value. If we non-dimensionalize total pressure by dividing P0 (Constant Value) then the pattern will be the same, of course the value will be some another value. In X axis in published data, it is x/D, which is also non-dimensionalized.
Although, I have attached a comparison plot for your clarity and better understanding.
Thanking you sir.
-
November 29, 2024 at 9:11 am
Essence
Ansys EmployeeAssuming the y+ ~ 1, growth rate of the entire domain is less than 1.2 and good orthogonal quality, please note the operating pressure you have applied. Therefore, the pressures you see will be relative to the operating pressure. You can also apply absolute total pressure if you need. You can also use High Order Term Relaxation, High Speed Numerics and CASM in Methods for stability. If you have moving shock waves, use Explicit instead of Implicit.
-
- You must be logged in to reply to this topic.


-
4763
-
1565
-
1386
-
1242
-
1021

© 2026 Copyright ANSYS, Inc. All rights reserved.

.png)
.png)
.png)
.png)
.png)
.png)
 - Copy.png)


