-
-
December 20, 2023 at 12:44 am
minusunny
SubscriberI am trying this example:
https://www.lumerical.com/learn/video/swg-bandstructures/
to extract effective index of first order and second order TE mode. I used source instead of plane wave given in the example as i need neff1 and neff 2. Both plane wave and source is giving me same values of effective index. But when i do the sweep, the wavelength value is different for mode 1 and mode 2. Please see the text file image:
Why these wavelength points are different, i did not change anything in the code? Also how can i extract values for same wavelength points for both modes?
I am trying to find the beat length of multimode interference device with SWG and using this model to extract the effective index. Is there any other way to do so?
Â
-
January 8, 2024 at 4:08 pm
Afroditi Petropoulou
Ansys EmployeeHello,
Is the example that you are using the SWG_bandstructure.fsp and the associated SWG_analyze_bandstructure.lsf script file?
If yes, as you can see in line 31 of the script file, the w_high_res parameter is calculated using the polynomial fit calculated in line 25. The wavelength is then calculated using this w_high_res parameter.
Different results can give different fits and hence different w_high_res and wavelengths.Â
Since you cannot avoid the polynomial fit, unless you create a new workflow, the easiest way to get effective index results at the same wavelengths would be probably by interpolating the data using the interp - script command. You can try to check if the data are interpolated properly.
Â
Best Regards,
Afroditi
-
January 8, 2024 at 11:40 pm
minusunny
SubscriberThanks. So where should i change the code? I need to extract effective index values for TE0 and TE1 to calculate the beat length. Is there any other way to do that?
Â
Minu
-
January 9, 2024 at 2:47 pm
Afroditi Petropoulou
Ansys EmployeeHello Minu,
I wouldn't suggest to change the script because in this case you would need to create a new workflow if you want to avoid the polynomial fit.
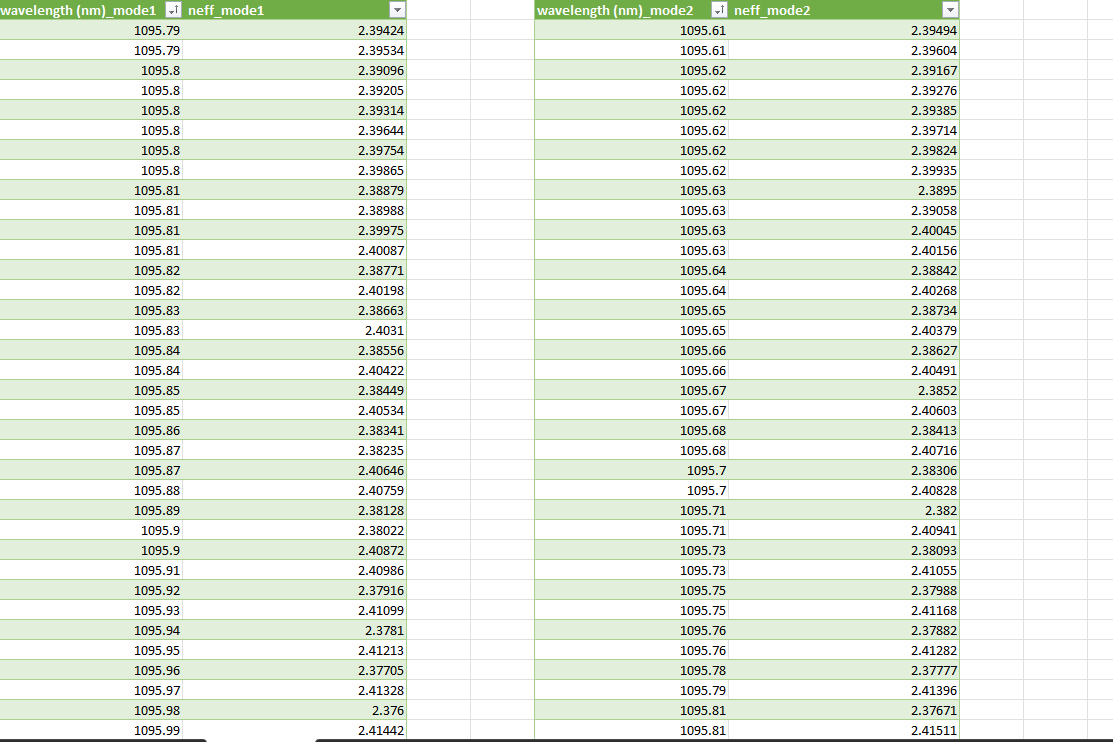
Since you have the data for both modes you can interpolate them.
If for example you have the following data for mode 1 (assuming in the brackets you have the values from the table you shared):
wavelength_mode1 = [... , ... , ... , ... , ... , ...]
neff_mode1 = [... , ... , ... , ... , ... , ...]
and for mode 2:
wavelength_mode2 = [... , ... , ... , ... , ... , ...]
neff_mode2 = [... , ... , ... , ... , ... , ...]
you can write the following commands:
neff_mode2_new=interp(neff_mode2,wavelength_mode2,wavelength_mode1);
plotxy(wavelength_mode2,neff_mode2,wavelength_mode1,neff_mode2_new,"wavelength","neff","");
legend("old data", "interp");This will interpolate the data of mode 2 to the wavelengths of mode 1 so that the effective indices of both modes correspond to the same wavelength points. The plot is suggested to check if the interpolated values are ok compared to the calculated ones.
Best Regards,
Afroditi
-
- The topic ‘The wavelength values are different’ is closed to new replies.
- Difference between answers in version 2024 and 2017 lumerical mode solution
- Errors Running Ring Modulator Example on Cluster
- Import material .txt file with script
- Trapezoidal ring
- Help for qINTERCONNECT
- Absorption cross-section of AuNR excited by prism-based TIR
- Issues with getting result from interconnent analysis script
- Topology Optimization Error
- How to measure transmission coefficients on a given plane .
- Edge Coupler EME Example Issue
-
1932
-
823
-
599
-
591
-
366
© 2025 Copyright ANSYS, Inc. All rights reserved.