-
-
September 11, 2025 at 6:42 pm
-
September 11, 2025 at 7:59 pm
NickFL
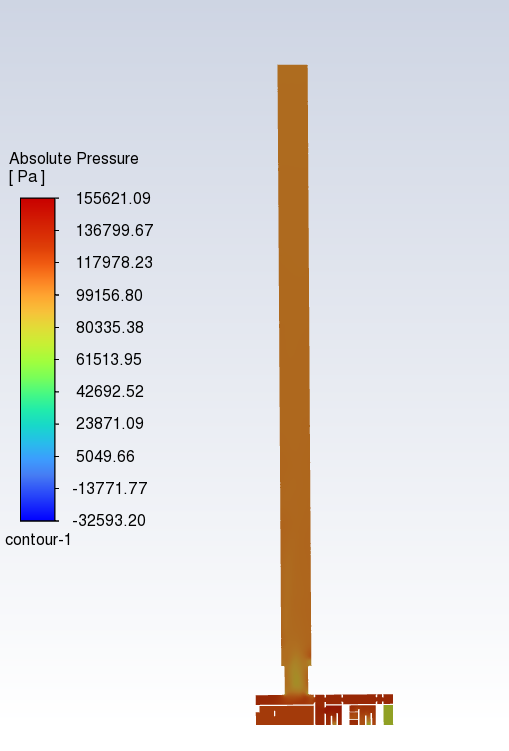
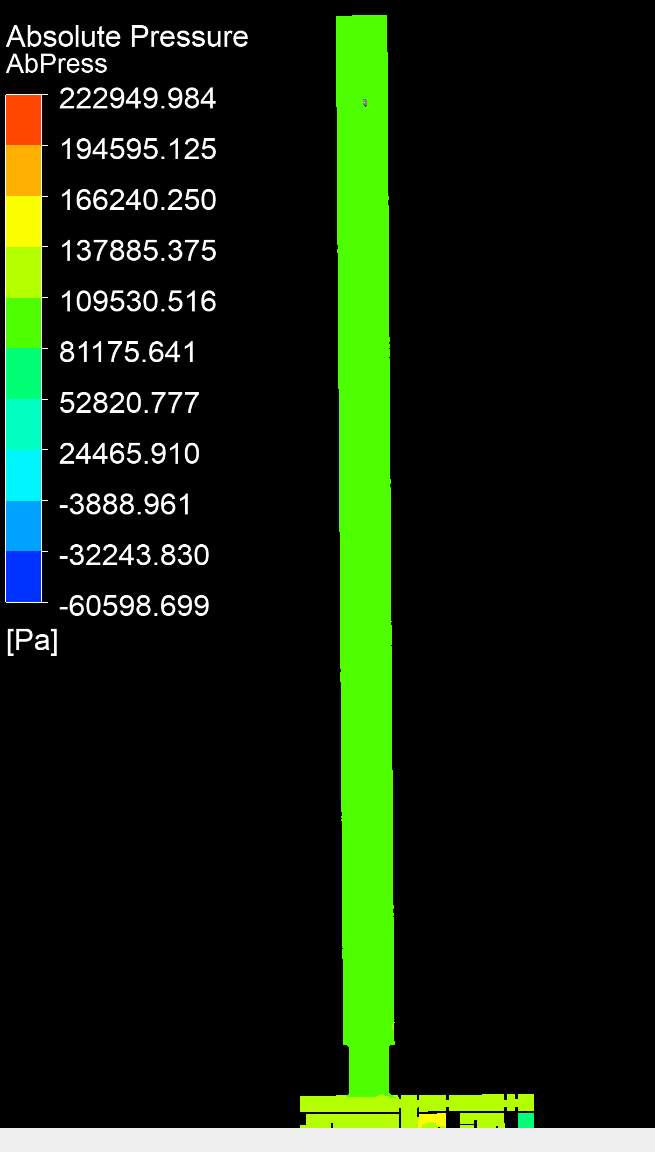
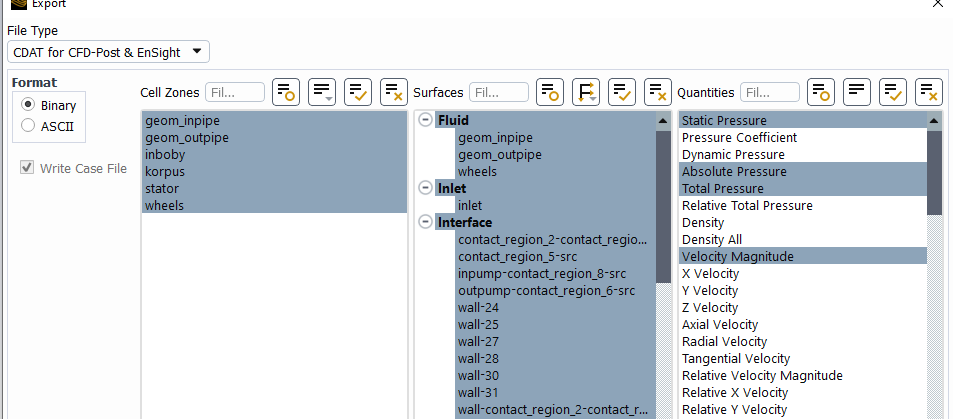
SubscriberThe scales are different so I find it difficult to tell. The green in the lower image is about 100e3 and that corresponds to the orange in the upper image. Can you repost with the same scale? You can even change the scale to both have bands or be smooth. That will also help visually. As for your Warning message, check in fluent to see what these surfaces are. -
September 12, 2025 at 7:43 am
B D
Ansys EmployeeHello,
Please use consistant option for the Range option while creating the contour for better understanding. You can use "Local" option to get good idea of variation within the selected surface.
-
September 12, 2025 at 9:08 am
Rob
Forum ModeratorAnd linking in the other thread, https://innovationspace.ansys.com/forum/forums/topic/the-results-are-different/
Plot all models into one CFD Post case for comparison and also compare in Fluent.
-
Viewing 3 reply threads
- You must be logged in to reply to this topic.
Innovation Space


Trending discussions


- Varying Bond model parameters to mimic soil particle cohesion/stiction
- JACOBI Convergence Issue in ANSYS AQWA
- affinity not set
- Resuming SAG Mill Simulation with New Particle Batch in Rocky
- Continuing SAG Mill Simulation with New Particle Batch in Rocky
- Is it able to solve turbomachinery using density-based solver in Fluent?
- Two-way FSI simulation
- Ensight Force_per_unit area_EV
- Question about generating Porous Jumps
- The result in FLUENT differs from CFD Post
Top Contributors


-
4562
-
1494
-
1386
-
1209
-
1021
Top Rated Tags


© 2025 Copyright ANSYS, Inc. All rights reserved.
Ansys does not support the usage of unauthorized Ansys software. Please visit www.ansys.com to obtain an official distribution.


