-
-
August 14, 2023 at 10:32 am
-
August 14, 2023 at 11:29 am
-
August 14, 2023 at 12:38 pm
Tushar Thakur L
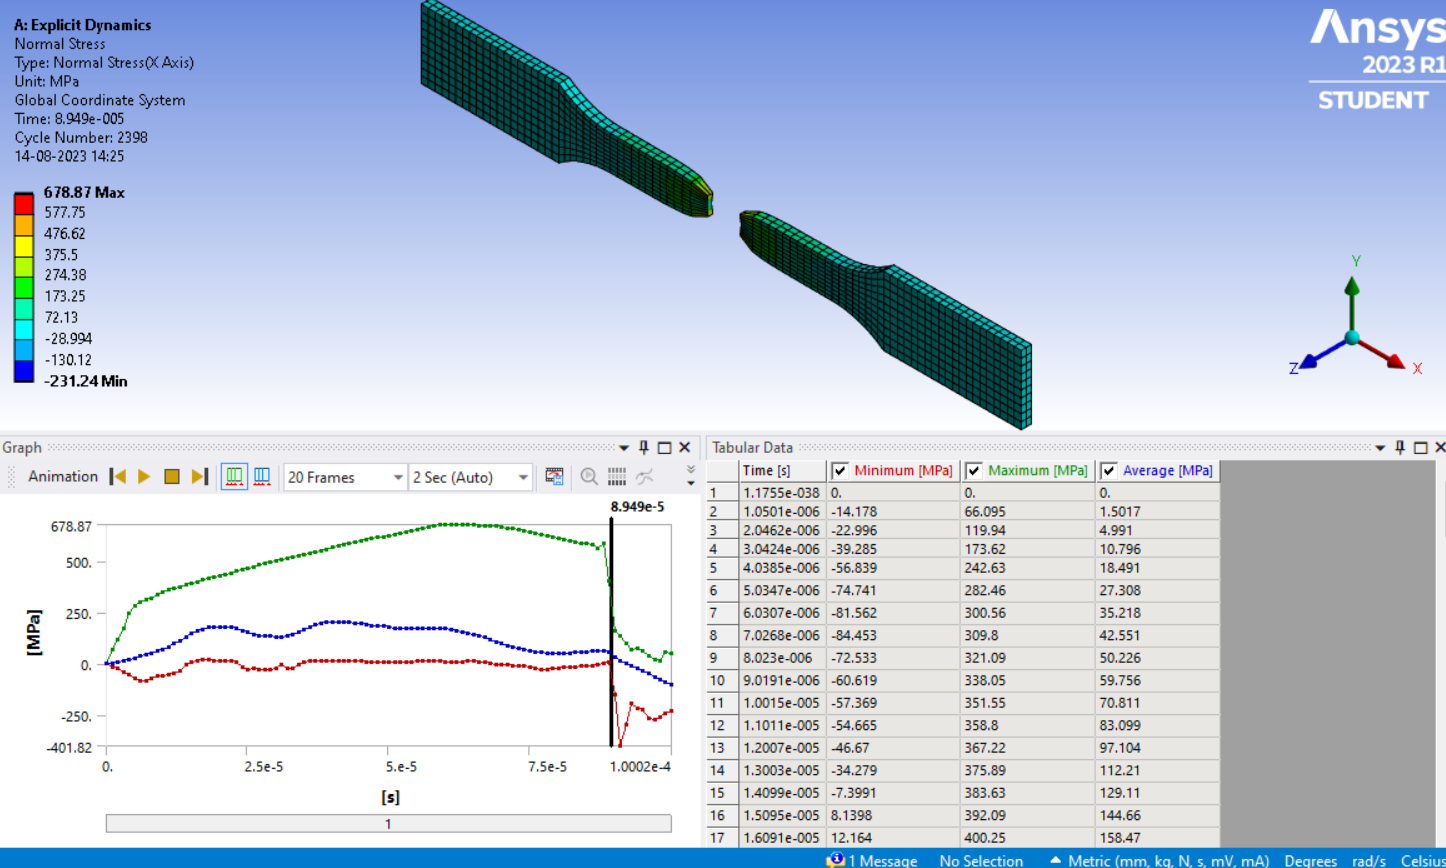
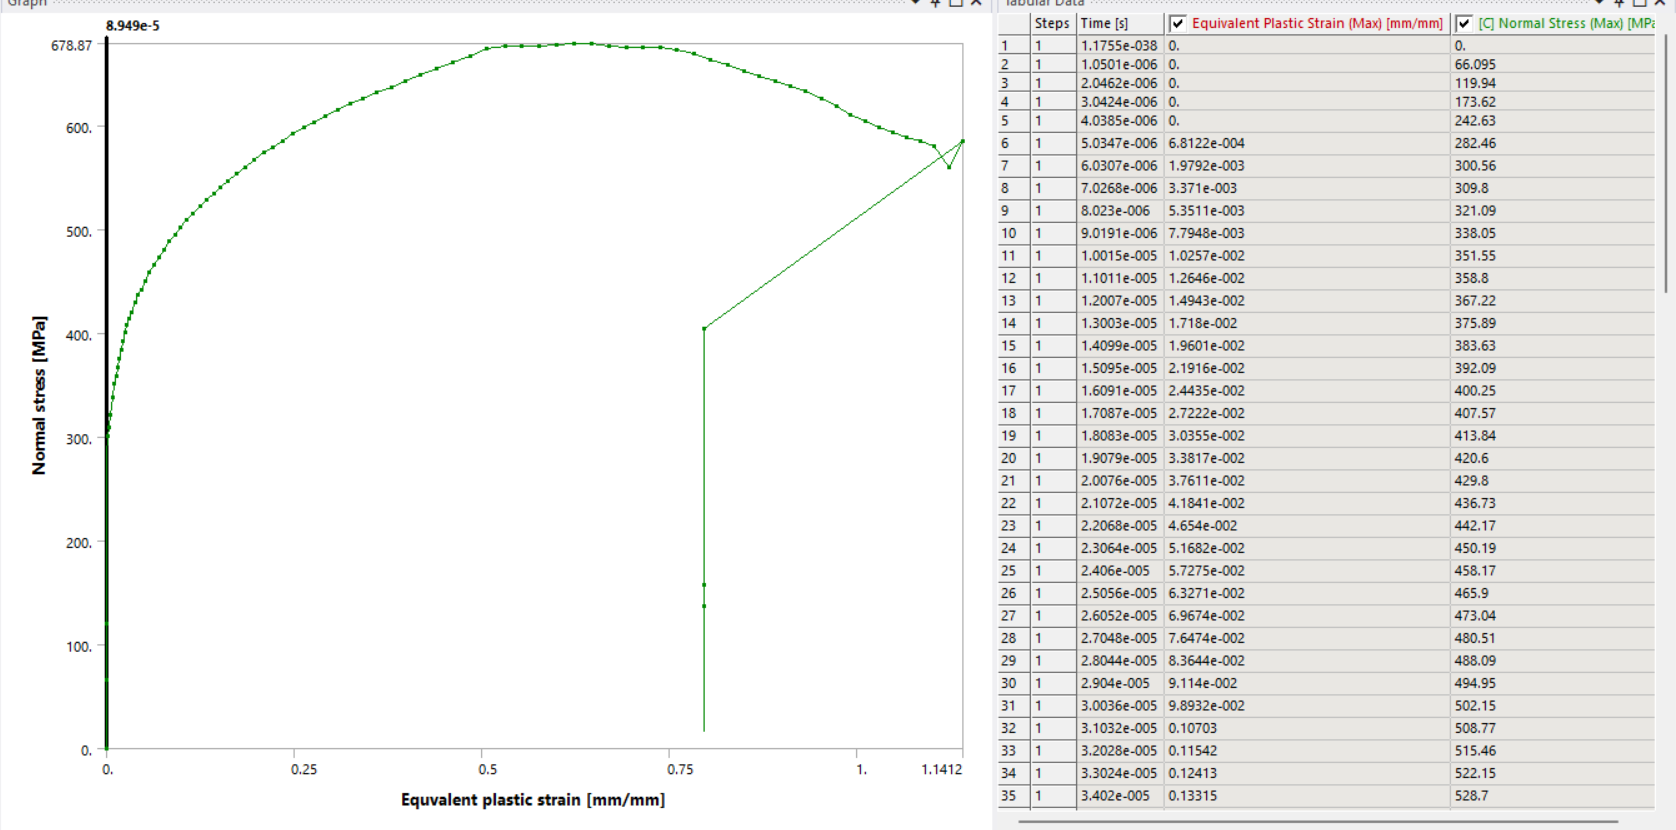
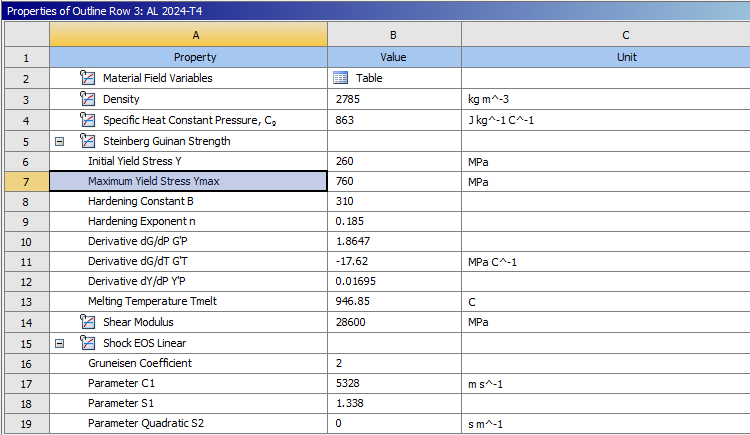
SubscriberThe given Max yield stress is way more for AL 2024 T4, so I changed some of the parameters and still the ultimate stress won't be that low.
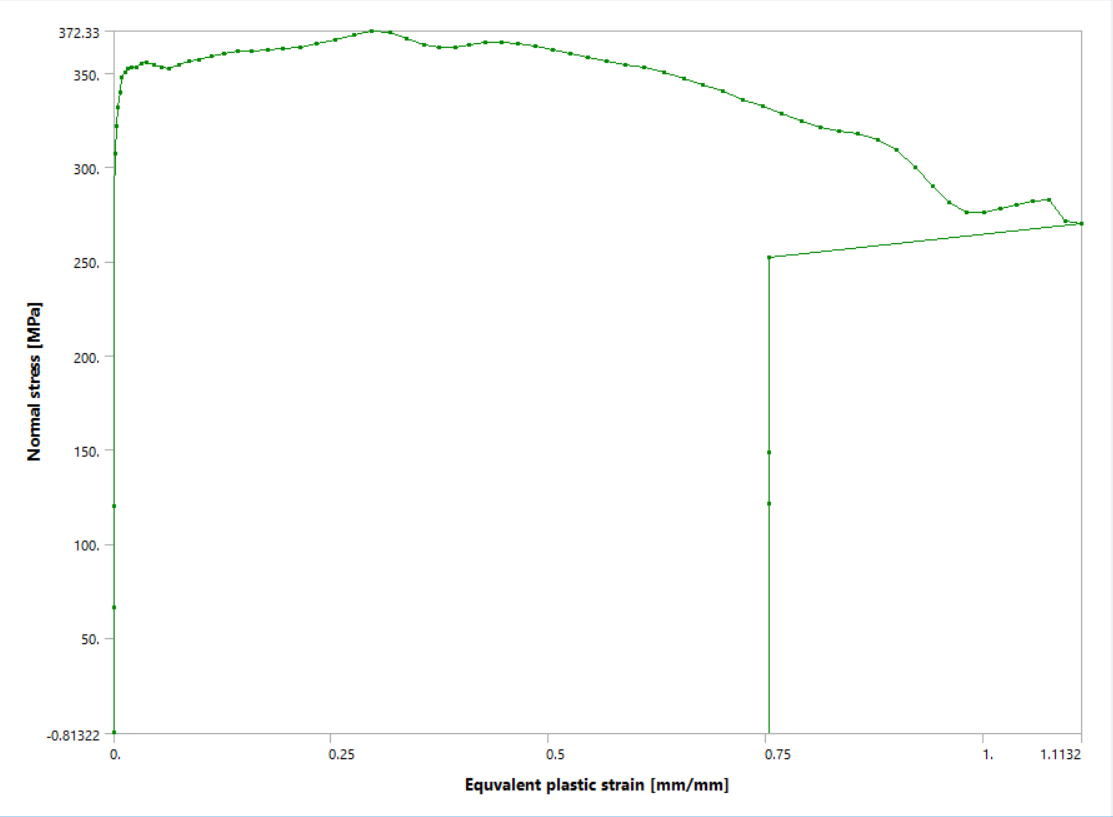
1) I have added Ultimate tensile stress as 469MPa but still, the analysis is not following the entered data. please help me with this problem and how to solve it.or what other ways I can solve it. -
August 14, 2023 at 4:53 pm
peteroznewman
SubscriberWhat experimental data do you have for AL 2024 T4? Do you have tensile test data in the form of a stress-strain graph and the table of values from that graph? Please show that.
-
August 15, 2023 at 6:12 am
Tushar Thakur L
SubscriberThe below link is the datasheet of AL 2024 T4. This is the only data I could find on the internet.
https://asm.matweb.com/search/SpecificMaterial.asp?bassnum=ma2024t4
1) The below image is a screenshot of AL2024T4 from the explicit dynamic.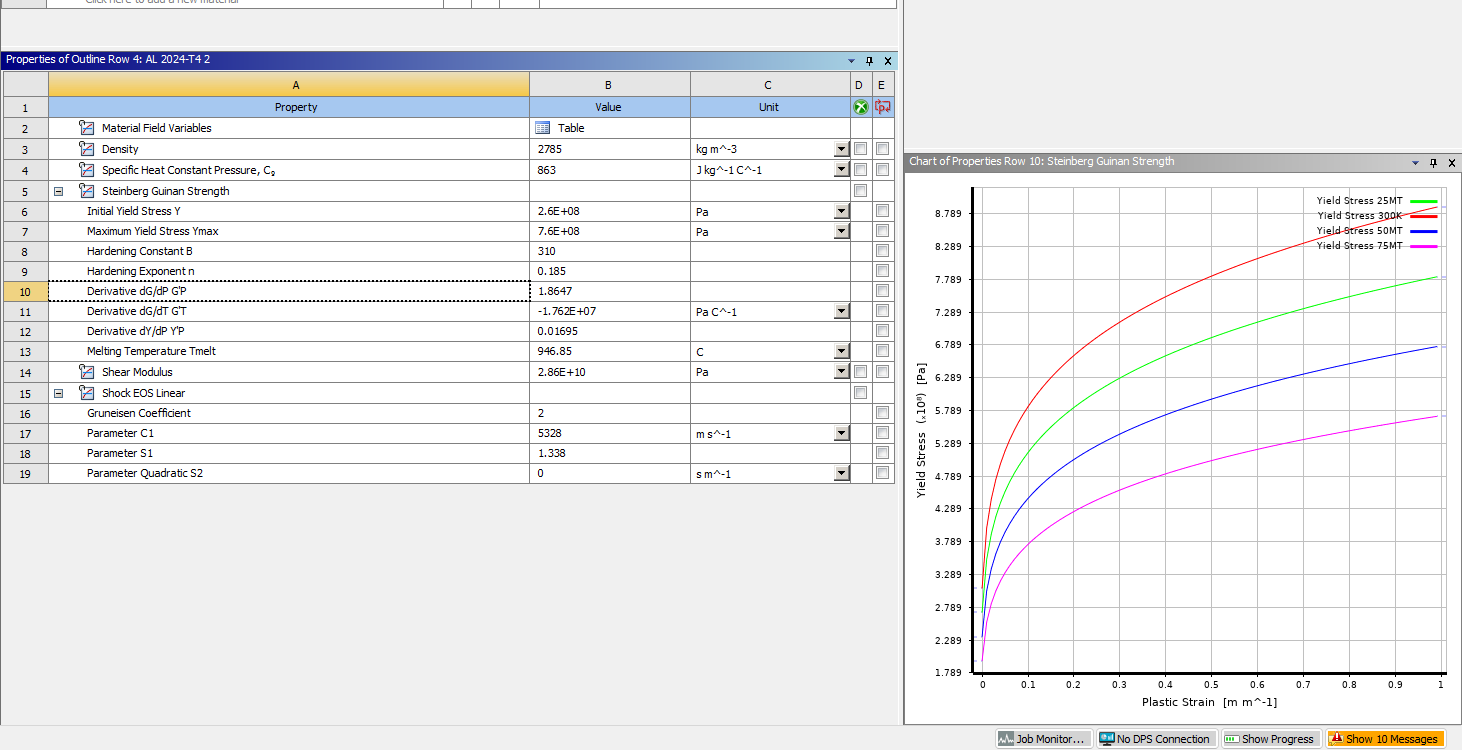
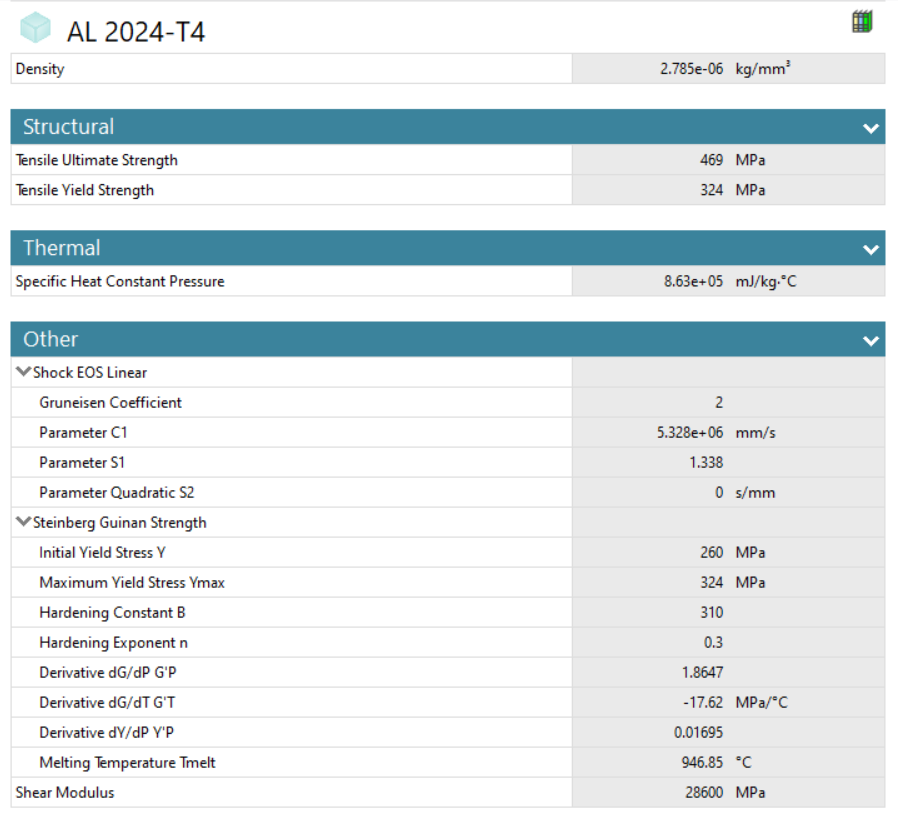
2) The below image is the screenshot of the updated AL2024 T4 data sheet, I have added Tensile ultimate and yield stress to it. I have even changed the initial and max yield stress.
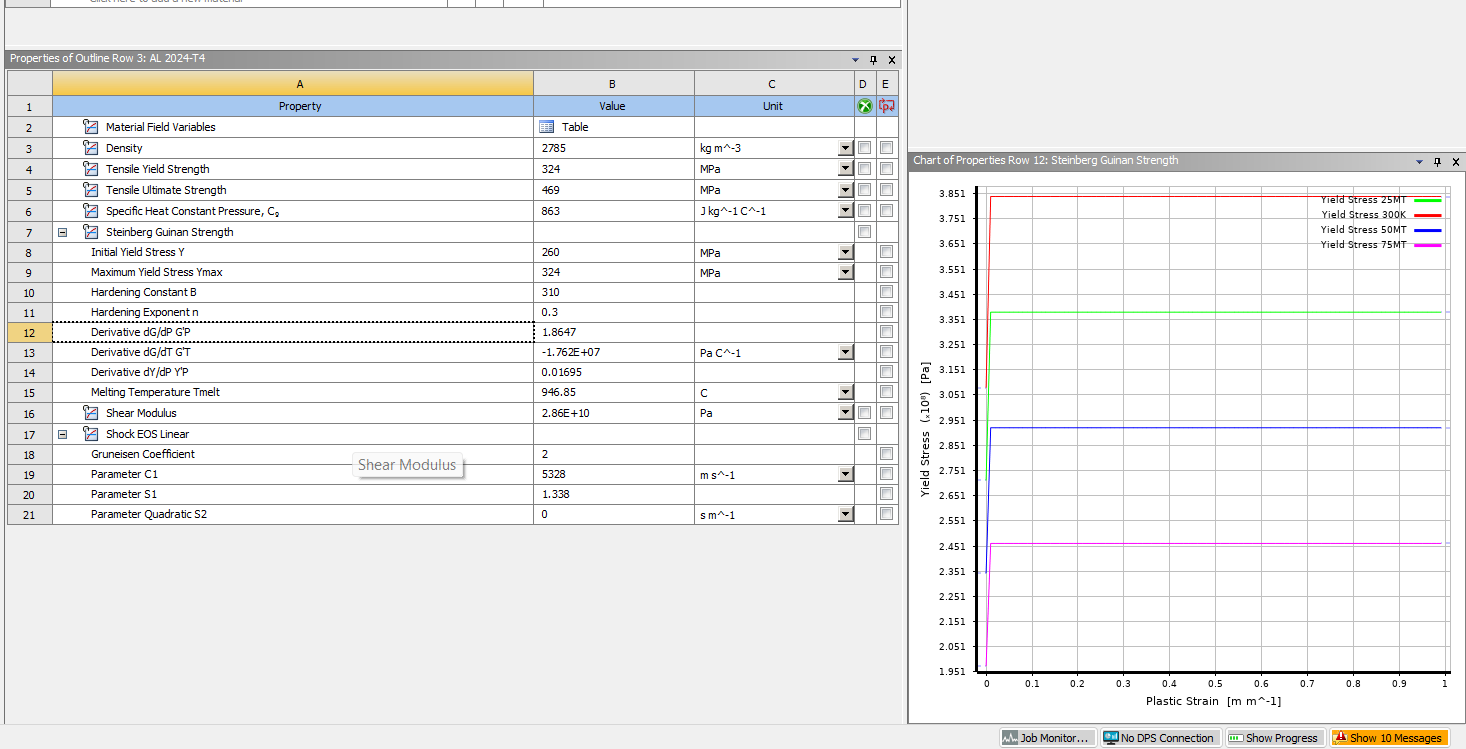
3) According to you, have I used any wrong data or method? Please let me know sir.
I appreciate your help.Thank you -
August 15, 2023 at 6:22 am
-
August 15, 2023 at 9:16 pm
peteroznewman
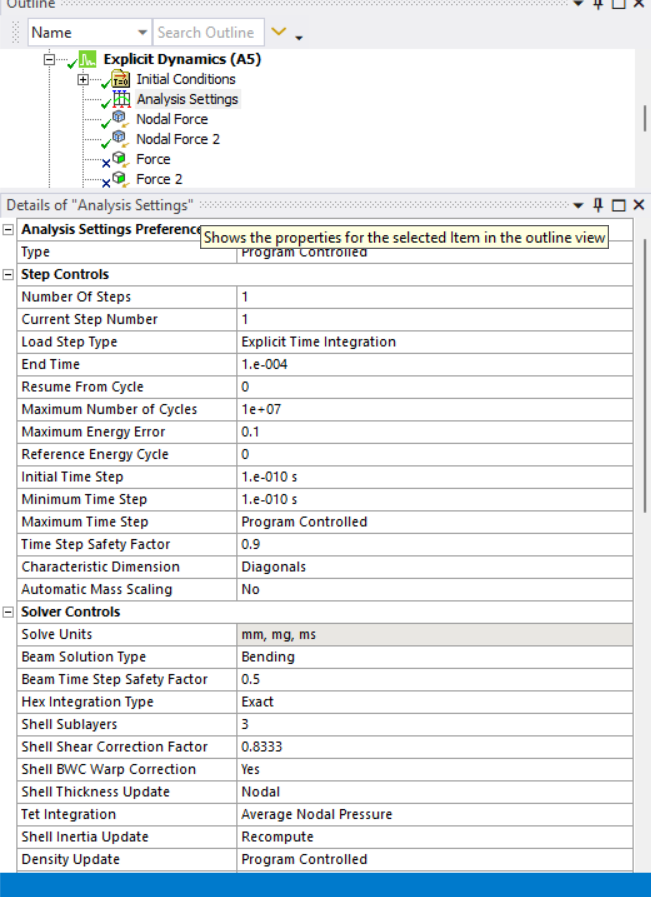
SubscriberThe published ultimate strength for AL2024-T4 is measured in a slow-moving tensile testing machine that may have taken 100 seconds to get to failure. Your simulation gets to failure in 0.00009 seconds. Your model is running more than 1 million times faster than a real test. I think that has something to do with the difference in ultimate tensile strength.
-
August 16, 2023 at 11:40 am
Tushar Thakur L
Subscriber -
August 16, 2023 at 8:47 pm
peteroznewman
SubscriberI would not use Explicit Dynamics, I would use Static Structural.
I would not use an Explicit Dynamics material. Those have equations that are useful for tracking very high strain rates that occur during explosions or high speed impact events.
Tensile testing is done to acquire input data for simulation models.
Why are you building a simulation of a tensile test? What do you want to see? In Explicit Dynamics, you see the part fracture into two pieces. You won’t see that in Static Structural. Instead you will see the stress and strain at the point when the fracture would have occurred.
-
August 17, 2023 at 2:45 pm
Tushar Thakur L
SubscriberI am building a simulation test to know its theoretical yield, ultimate stress, and elongation. To find out what method I should follow, can you please tell me?
-
August 18, 2023 at 1:04 am
peteroznewman
SubscriberYou have it backwards. You do experimental testing of a standardized coupon of the material to measure its yield strength, ultimate strength and elongation at break. You take those values from the experimental testing and use them to evaluate simulation model results to predict if any other part that you might design has reached the point of failure, by having a Von Mises stress that exceeds the yield strength, for example.
You can simulate the standardized coupon using Static Structural and a linear elastic material model of aluminum and determine the load at which the material will exceed yield strength.
-
August 20, 2023 at 6:18 am
Tushar Thakur L
Subscriber -
August 20, 2023 at 6:30 am
-
August 20, 2023 at 12:33 pm
peteroznewman
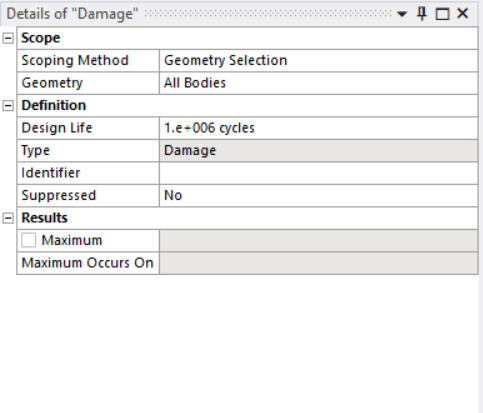
Subscriber"Design Life"
Here is what the Ansys Help says about Fatigue Damage...
"Fatigue damage is defined as the design life divided by the available life. The default design life may be set through the Options dialog box. A damage of greater than 1 indicates the part will fail from fatigue before the design life is reached."
You decide on the Design Life for your application. That may be a specification on the design, if not, the engineer, product manager or customer must choose a value.
"What is the right load for fatigue testing?"
Are you asking about fatigue testing to obtain material data to create an SN-Curve in Engineering Data? Here is my answer:
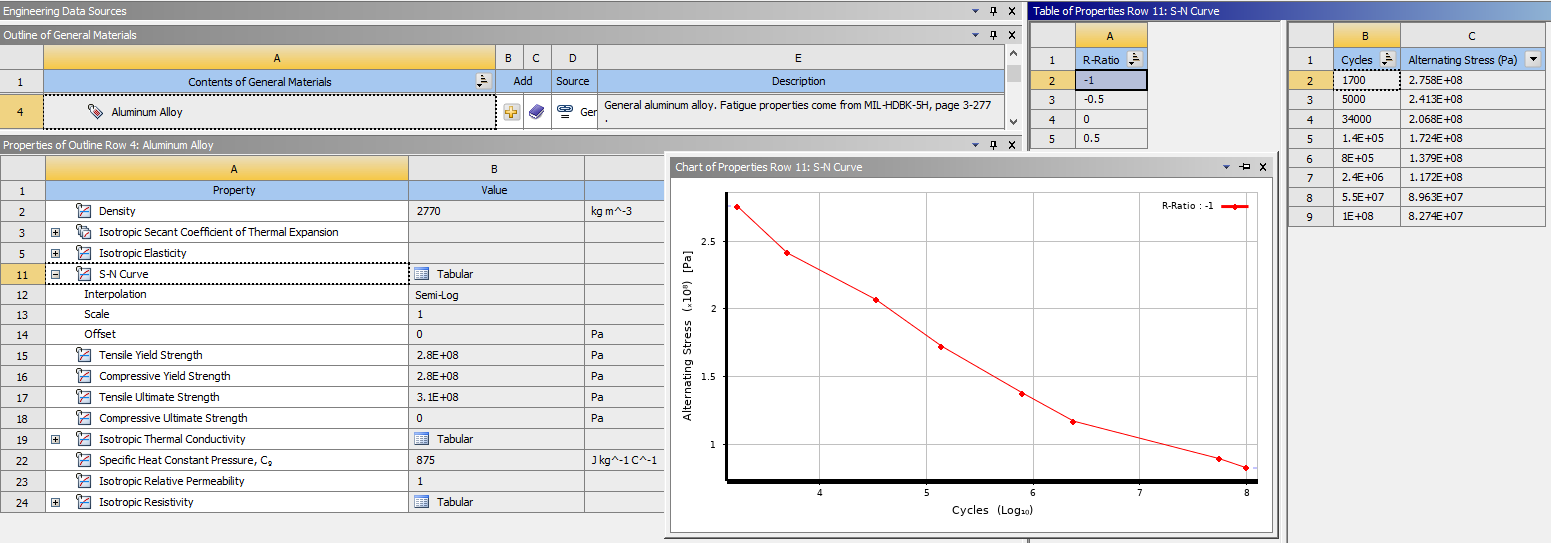
Look at the SN fatigue data for Aluminum Alloy in the General Materials database that comes with Ansys. There are 8 points on this curve for fully reversed loading (R-Ratio = -1).
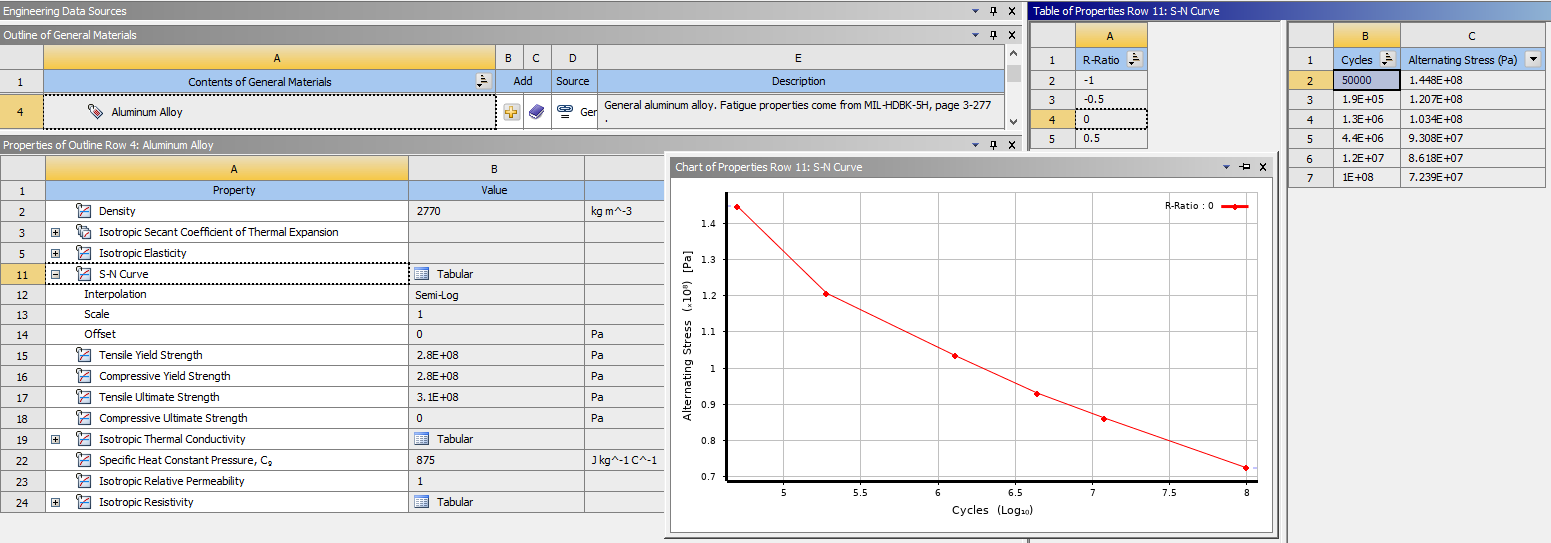
There are 6 points on the curve for zero-based loading (R-Ratio = 0).
There are also two other R-Ratios with data in them that make up 10 more load sets, for a total of 24 load sets.
Each load set may have had 10 samples that were run on a fatigue testing machine to measure the cycles at failure, so a total of 240 tests. This is the kind of effort it takes to obtain data that can be used to predict fatigue in parts that you design that may be subject to a variety of load cases.
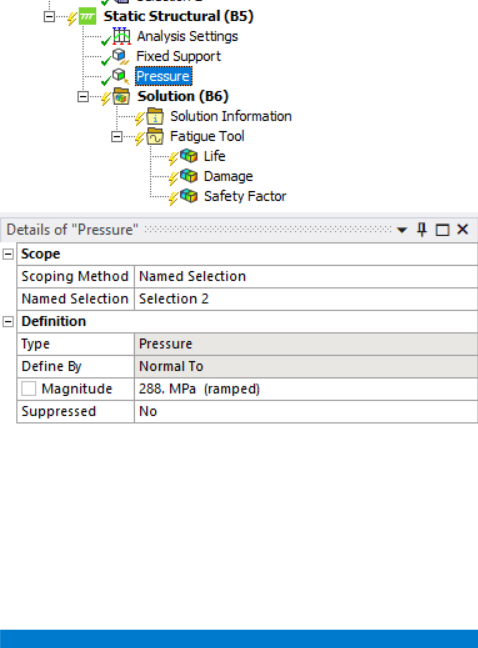
"What is the right load to apply?"
Are you asking about a specific part shape to do fatigue analysis (not testing) and you already have the SN Curve for the material?
Are you asking what pressure to apply to your part shape to obain these values of stress? That depends on the shape of your part. Note that if your part is long and slender like a tensile test coupon, it may buckle under compressive loads.
What component of stress is used to measure Alternating Stress?
Alternating stress is the difference between the maximum and minimum normal (axial) stresses experienced by a material during each cycle of loading.
-
August 20, 2023 at 1:55 pm
Tushar Thakur L
SubscriberThank you very much Peter, I appreciate your help. thank you again.
-
October 21, 2023 at 1:40 pm
Desi Gustiani
SubscriberHallo Mr Peter, If you are willing can you help me? I really appreciate your help. I want to carry out a tensile test simulation with AISI 4140 material, actually I don't know the correct tensile test simulation process. Is there a video that you suggest or a discussion that I can learn from to carry out a tensile test simulation?
-
October 21, 2023 at 1:41 pm
Desi Gustiani
SubscriberThank you so much.
-
October 22, 2023 at 10:44 am
peteroznewman
SubscriberHello Desi,
Why do you want to simulate a tensile test? Read my August 18 reply to Tushar.
-
October 22, 2023 at 11:11 am
Desi Gustiani
SubscriberI have experimental graph data for the tensile test of AISI 4140 material, I want to carry out a simulation and compare the stress and strain graphs from the experimental and simulation data.
If the simulation and experimental data have close values, I would like to carry out a variation of the tensile test simulation for a research project for my college assignment. If you could explain it to me I would be very grateful. Thank you very much. -
October 22, 2023 at 11:13 am
Desi Gustiani
SubscriberHallo Mr Peter.
-
October 23, 2023 at 10:23 am
peteroznewman
SubscriberHello Desi,
Step 1 in the process is to create a Material Model that includes Plasticity. The model to use a Stress-Strain curve is Multilinear Kinematic Hardening. Experimental data will be Engineering Stress and Engineering Strain values. Ansys requires the data to be True Stress and True Strain so the first step is to convert your data. Please take the free course in Metal Plasticity In your next reply, show how you converted your data to True values.
-
October 24, 2023 at 1:58 pm
Desi Gustiani
SubscriberHello Mr.Peter
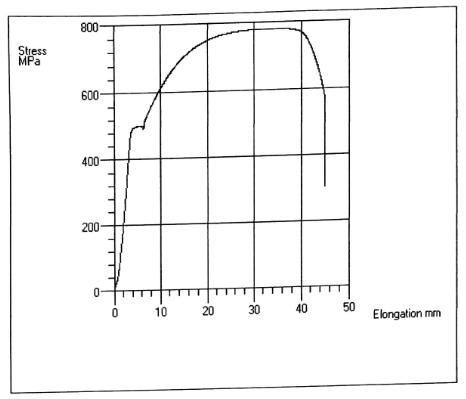
This is my eksperiment Tensile test Result.
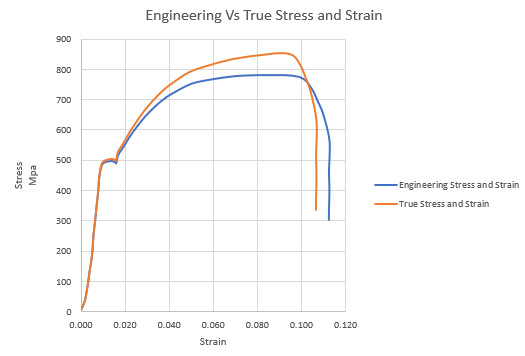
I took this graph data using Graph Grabber software, and I created a Stress and Strain graph.
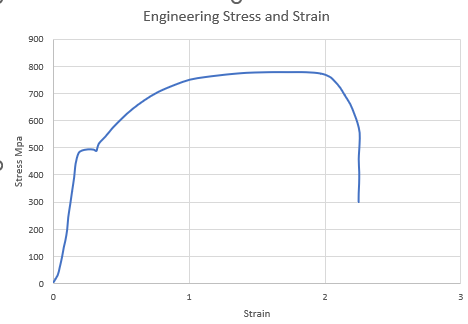
This is my Engineering Stress and Engineering Strain.
I have convert From Engineering data to True Stress and Strain with this Vormula [From Ansys course]:
I have Result Engineering vs True Stress and Strain data like this:
Are my steps correct sir? What can I do for next step ?
Thank you very much Mr Peter, I appreciate your help. Thank you again.
-
October 24, 2023 at 10:31 pm
peteroznewman
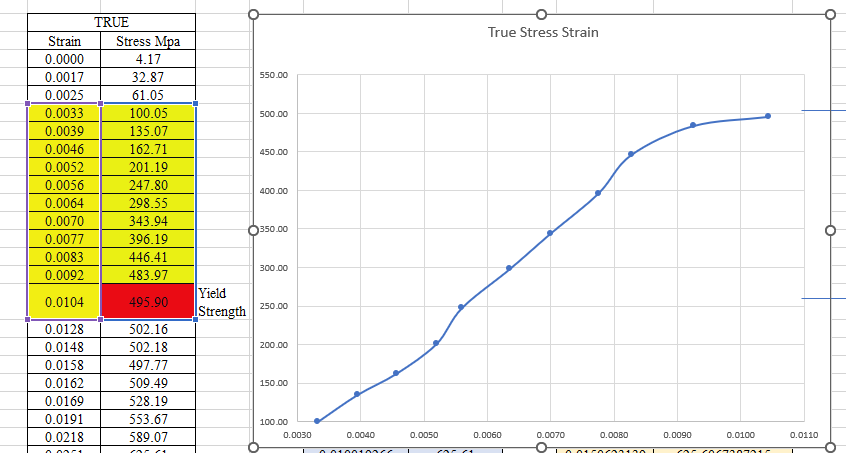
SubscriberFirst you need to Fit a line to the straight part of the curve between 200 and 400 MPa. Notice that the initial part of the curve from 0 to 100 MPa has a different slope. That is the sample seating into the clamps and must be excluded. The line fit to the linear portion of the curve will intersect the Strain axis at some small offset value. Create a new strain column where you subtract the offset from the strain so the linear elastic part the curve starts at 0,0. The slope of the line fit to the data is the Young’s Modulus, E. Add an Isotropic Elasticity model from the Linear Elastic part of the toolbox to your material and use this value of E for the Young’s modulus.
Second you need to decide on the Yield Stress. Decide when the curve departs from the straight line fit in step 1 above. That is the Yield Strength.
The equations to convert Engineering Stress and Strain to True Stress and Strain are only valid until necking occurs in the sample. This is the point when the True Stress-Strain curve has a zero slope where the maximum stress occurs. Delete all the data after the maximum value of True Stress is reached. Create a column in your spreadsheet for ElasticStrain = TrueStress/E.
Third, create a column in your spreadsheet for PlasticStrain = TrueStrain – ElasticStrain. You only want rows for Plastic Strain that start at 0 on the row with the Yield Stress. Delete any rows that have negative Plastic Strain.
Finally, copy the PlasticStrain and TrueStress columns and paste them in the Multilinear Kinematic Hardening Plasticity material model. The first row must have 0 for Plastic Strain and the Yield Stress and the rest of the rows should have increasing values of stress.
-
November 5, 2023 at 3:58 pm
Desi Gustiani
SubscriberHello Mr.Peter
I have finished following the steps you explained, sir. Thank you very much.
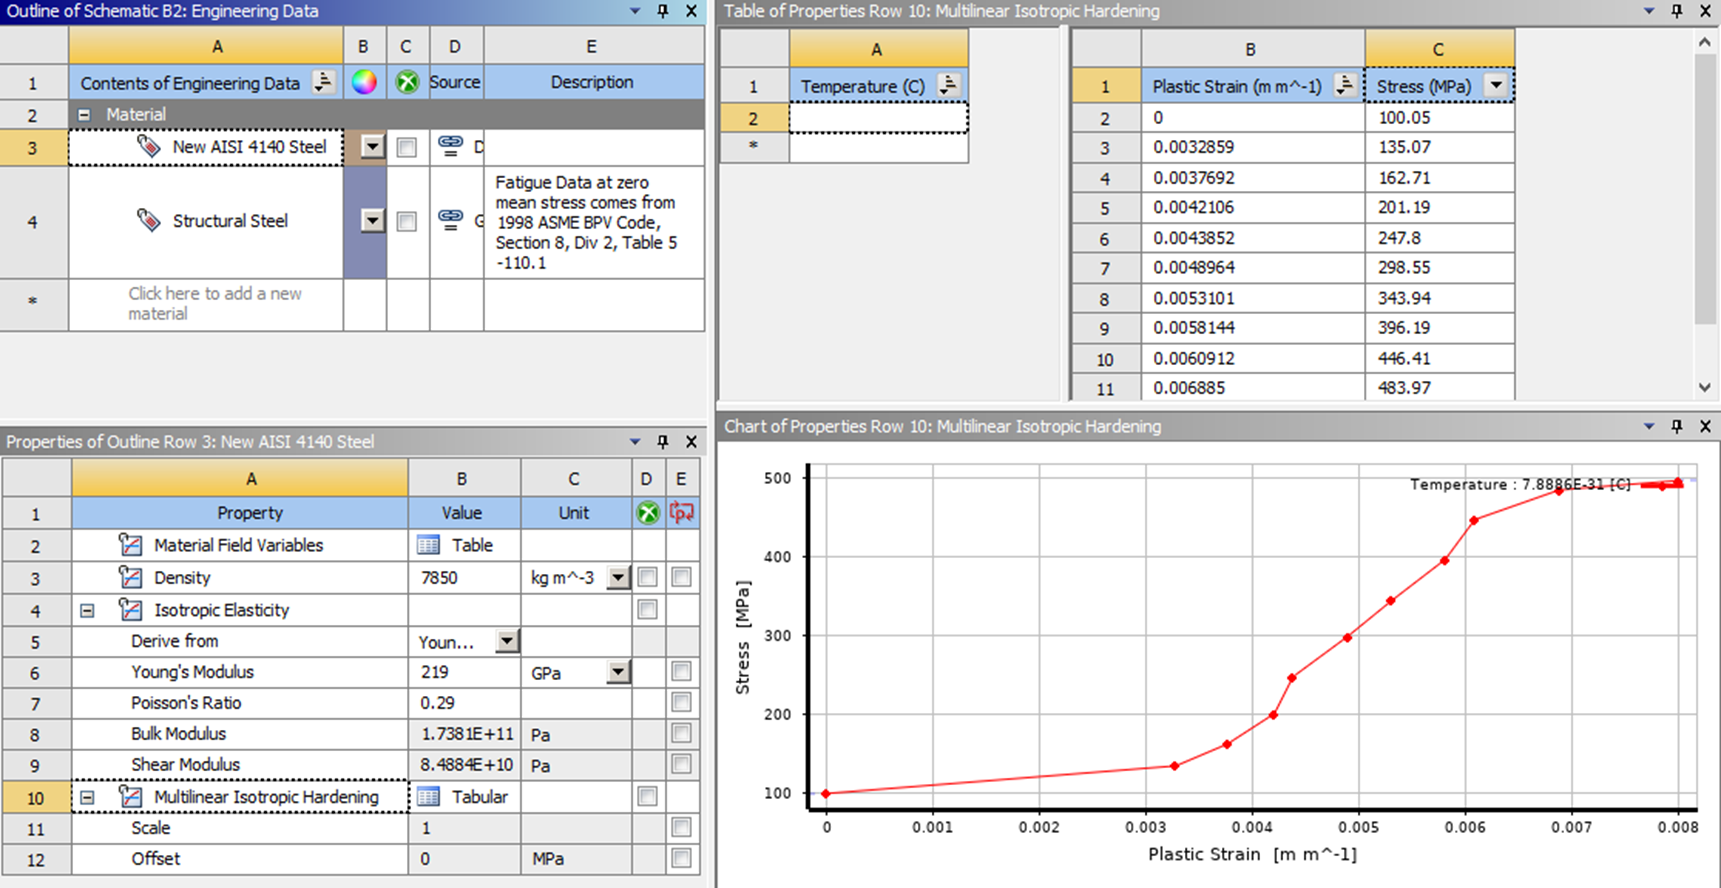
However, I needed help. Below, I show the results of the Plastic Strain data that I got. I try to input the plastic strain data to the Multilinear Kinematic Hardening Plasticity material model in Ansys. But, The graph shows this result, and there is an error notification before I start the simulation steps. Is this error from my data? Can you explain this to me, sir?
Warning "Material AISI 4140 has a Multilinear Isotropic Hardening property defined with 1 temperature curves. Multiple temperature curves or more than 10 stress strain pairs are not supported in Explicit Dynamics analyses.
Thank you very much for your help; if you are right and allow me, may I ask for your email to be able to communicate via email?
Thank you again. -
November 5, 2023 at 5:38 pm
peteroznewman
SubscriberYou are not following the directions I wrote. You did not fit a straight line to the data between 200 and 400 MPa. You did not subtract the offset from the strain data.
You selected 495 MPa for the Yield Strength (I would have chosen 446 MPa). But you did not type 495 in cell C2 of the Multilinear Plasticity material model. Using 100 MPa is a mistake.
Follow the directions in the warning and keep 10 points of plastic strain instead of every point in the spreadsheet.
Upload your spreadsheet to your Google Drive or other file sharing sites and paste the link in your reply and I will check your work.
I prefer to communicate on this site. It is better than email for me.
-
December 31, 2023 at 4:46 pm
Mohamed Farmaan
SubscriberHello Mr Peter, I have an issue closely related to the current post. I am having issues replicating the failure region of the stress-strain curve. I am using PLA material, and for the elastic and plastic regions of the curve, I used the isotropic property and multilinear isotropic hardening, and I was able to recreate the curve nearly perfectly until the ultimate strength point. I am not able to create the failure region of the curve. I used static structural analysis for the simulation. From my research, I came across one of your posts, /forum/forums/topic/i-want-to-see-the-failure/ which talked about viewing failure and wanted to contact you but couldn't. I very badly need your help, dude.
-
-
December 31, 2023 at 10:14 pm
peteroznewman
SubscriberExperiments record data in Engineering Stress and Strain and that must be converted to True Stress and Strain to use in the Multilinear Isotropic Hardening table. Did you do that?
Analysis output is always in True Stress and Strain.
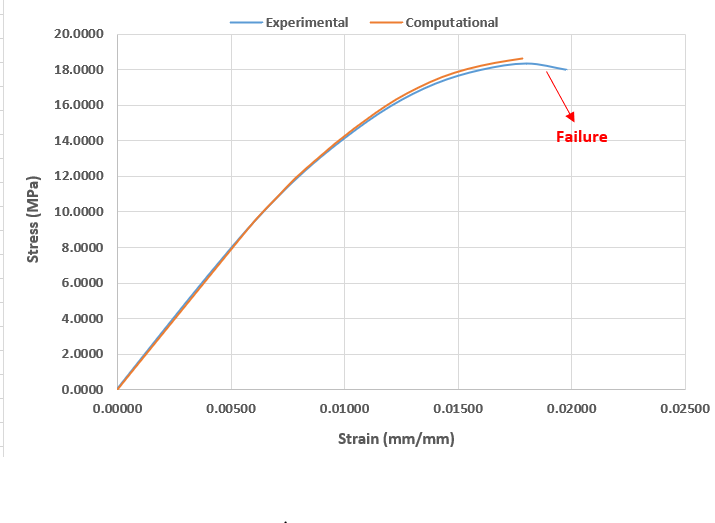
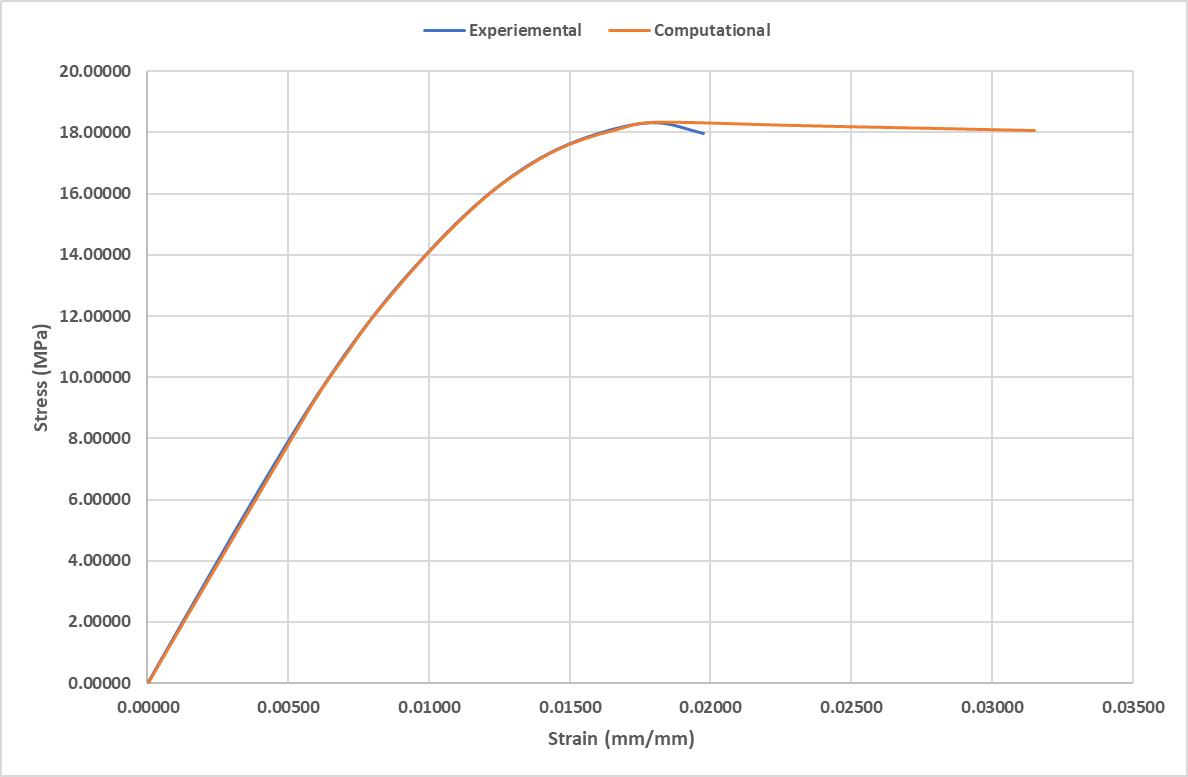
In the plot that overlays the Experimental and the Computational values of Stress and Strain, are you plotting Engineering Stress and Strain or True Stress and Strain?
The Experimental curve shows a negative slope. Did the experimental sample exhibit necking behavior?
The necking portion of the experiment must be excluded from the conversion to True Stress and Strain because it violates the constant volume assumption of plastic deformation.
-
January 1, 2024 at 5:55 am
Mohamed Farmaan
SubscriberYes, to answer your first question, I calculated the true stress and strain to enter for the true stress value in multilinear isotropic hardening and the plastic strain from the elastic strain calculated from the true stress value.
True, I understand that the output is true stress and strain, since the input I gave is the true stress data and the plastic strain data.
The ‘experimental’ labeled spline is the engineering stress-strain plot, while the computational is the analysis output.
Yes, and this is the portion I would like to plot when I do the analysis, but I am having difficulty trying to figure out how to plot the negative slope.
Yes, I took that into consideration for the analysis and plotted until the ultimate strength point. I didn’t include the negative slope data.
-
-
January 1, 2024 at 2:24 pm
peteroznewman
SubscriberIt would be better to convert the Computational data to Engineering Stress and Strain to overlay on the Experimental data. In that way you are comparing data on the same scale. To do that, divide the Reaction Force by the original area and divide the change in gauge length by the original gauge length.
Simulation will often exhibit necking behavior. If you see that and convert the simulation data to Engineering Stress and Strain, you will see a negative slope at the end of the simulation instead of a positive slope in the Stress-Strain plot.
-
January 1, 2024 at 2:46 pm
-
-
January 1, 2024 at 3:59 pm
peteroznewman
SubscriberThe experimental results show the Elongation at break is 0.0195 mm/mm. Don't plot the computational results past that point. The difference in stress at that strain is 18.4 vs 18.0 MPa which is only a 2% error. The small deviation is only from 0.0175 to 0.0195 strain so strains up to 90% of failure have a small fraction of 1% error.
What part designs will you analyze using this material model?
What is the failure criteria for these part designs?
What Factor of Safety will be used with this failure criteria?
A small Factor of Safety is 1.2 or 20% which is much larger than the 2% that occurs only in the last 10% of the load.
I suggest that the material model is more than adequate for all kinds of design analyses.
-
January 1, 2024 at 7:07 pm
Mohamed Farmaan
SubscriberGot it, Mr. Peter. You have been such a huge help. Thank you very much. This model for PLA is just a simple tensile test replication from a research paper. However, I am also studying its thermal effects by carrying out FSI analysis and simple tensile tests under high temperatures. I need a reliable computational model to lean on for a foundation, so I am carrying out this initial step. I have one question left: if at all I need my computational model to be perfect, including the failure region, are there any failure models that will help me attain the results I need? Also, in the current model, what property or variable might cause the variation in the failure region from the simulation result?
-
-
January 1, 2024 at 8:43 pm
peteroznewman
SubscriberThere is no such thing as a perfect computational model. What is important is to characterize the scope of the model. What are the limits on loads, boundary conditions and mesh refinement that give acceptable levels of error of the computational result from the experimentally validated result. Will the loads and boundary conditions include going past the point of ulitmate stress?
You mentioned a FSI model, how are you going to validate that? Are you going to obtain experimental data for the CFD results?
-
January 2, 2024 at 6:35 am
Mohamed Farmaan
SubscriberYes, I would be carrying out experimentation, but since this is an independent research project, I am in search of laboratory partners that would help me carry out the research.
-
-
- The topic ‘Tensile test of AL 2024 T4 to calculate ultimate and yield stress’ is closed to new replies.


-
4803
-
1576
-
1386
-
1242
-
1021

© 2026 Copyright ANSYS, Inc. All rights reserved.

