TAGGED: ansys-explicit, compression, erosion, material, programming, residual-stress
-
-
August 25, 2022 at 1:29 pm
glasgowcer
SubscriberHi everyone!
(@Peteroznewman)
I am trying to study the impact absorption capacity of different materials. The aim is to calibrate the ANSYS model and obtain the deceleration curves (G's or m/s2) as a function of material, thickness, contact area, impact velocity and mass of the body to be protected.
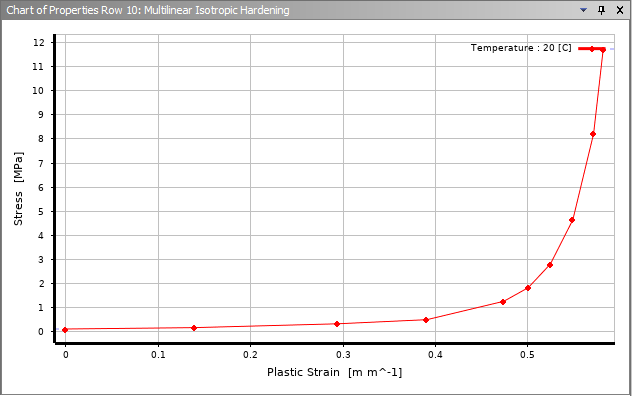
All materials are similar but since we have data to validate the results, the material chosen for this POST is EPS (20 kg/m3). For this, I have Isotropic Elasticity Material properties (Young Modulus and Poisson ratio) and the stress vs. strain curve (compression). This curve has been included in the plasticity model "Multilinear Isotropic Hardening". Furthermore, Maximum Tensile Stress and Maximum Shear Stress values have been obtained from the available literature.
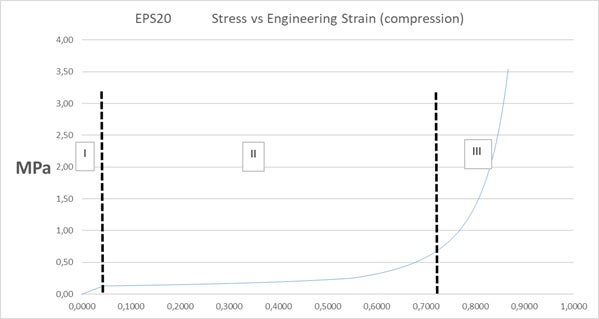
It should be noted that the stress that the material is able to withstand is much higher in compression (see graph below) than tensile/shear (Tensile Stress = 0.18 MPa and Maximum Shear Stress = 0.33Mpa).
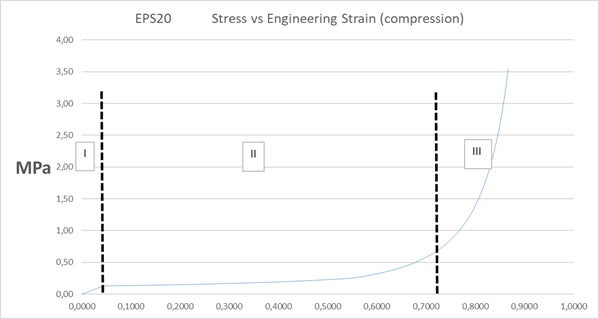
This curve is characterised by three well-defined zones (I) Linear elasticity; (II) Collapse plateau; (III) Densification.
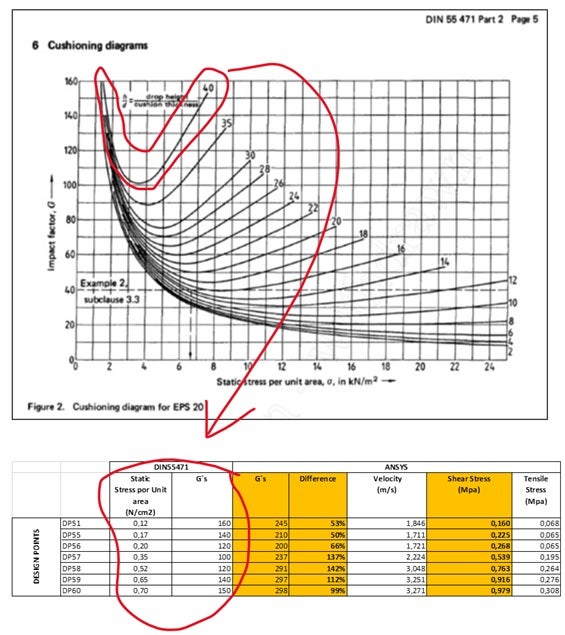
To validate the model, the curves in DIN55471-2 can be used.
These experimental curves, for a given factor (drop height / cushion thickness), show the maximum deceleration value that would be obtained as a function of Static Surface Load (KN / cm2). In our case, we take: drop height=100 cm; cushion thickness=2,5 cm; m=4,7 kg or 46,11 N.
According to stress vs strain curve the previous experimental curve shapes can be explained. There is a minimum of G's, this minimum occurs if the impact conditions take full advantage of the plastic deformation zone. For lower Static Surface Load, there is also plastic behaviour, but less predominant as there is an important elastic component. Beyond the minimum, for higher Static Surface Load, the material deforms and completes the plastic phase and enters the densification zone, here the stress increases exponentially increasing the G's value.
If the curve points are simulated using Transient Structural or even, Explicit without a failure criterion, the shape of the curve is equivalent to the experimental curves. However, it is shifted upwards with significantly higher G values (deceleration peak) in all cases. This is because the material has an energy dissipation mechanism through the failure of the material itself, most likely by Tensile and/or Shear stress.
This is not possible to simulate through Transient Structural so it is done with Explicit, introducing the Failure Criteria through Maximum Tensile Stress and Maximum Shear.
The problem is, when the material reaches the values defined for that criterion, the elements are removed from the model. This produces values of G's similar to those expected in the area before the minimum. However, at values to the right of the minimum, in the zone of densification, the value of G's shoots up. The reason for this is that the material has failed by tensile/shear and the erosion method removes the elements, however these elements should separate from each other and remain in place to continue working in compression in their plastic/densification zone.
Is there any solution for this?
I am getting desperate with this model and would really appreciate any help as I am not an ANSYS expert although I hope to become!
Many thanks in advance.
Attached is the "xxxxx.wbpz" file, version 2022 R2 (Student).
https://we.tl/t-xT5wQinxun
-
August 28, 2022 at 8:41 pm
peteroznewman
SubscriberI found an article that contains experimental data that is useful to create a simple plasticity material model that would represent the compression of EPS20.
https://www.semanticscholar.org/paper/Compression-tests-for-EPS-blocks-used-in-Neto/6a4e2b7f86c8ece05fa5d71e9c9e182520e9af91
The simplest model would be Bilinear Kinematic Hardening. Try using this material in Transient Structural instead of Explicit Dynamics.
-
August 29, 2022 at 8:51 am
glasgowcer
SubscriberHi @peteroznewman!
Thank you for your answer but that model is even simpler than mine and it does not fix problem posed regarding the failure mode and the energy dissipation mechanism. Any other approach? May be programming?
-
August 29, 2022 at 12:53 pm
peteroznewman
SubscriberEnergy is dissipated while plastic strain develops. When the motion reverses, the stored elastic strain recovers some portion of the maximum deformation during rebound. Solving in Transient Structural avoids the problems introduced by Explicit Dynamics, but Transient Structural will have its own set of problems.
-
August 29, 2022 at 1:11 pm
glasgowcer
SubscriberThank you again! You are right but as I explained at the beiginning, I also tried with Transient Structural (see the *.wbpz file) and Transient Structural does not include failure mode, which also disipates energy. So problem is still there :(
-
-
August 30, 2022 at 2:45 am
peteroznewman
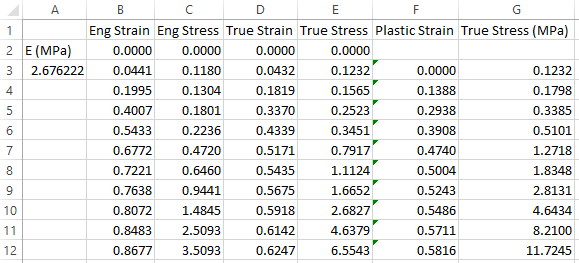
SubscriberI digitized this graph you provided.
This is in terms of Engineering Stress and Strain, so I converted it to True Stress and Strain as required in Multilinear Isotropic Hardening.
The last two columns go in the Engineering Data for Multilinear Isotropic Hardening.
I meshed a 1 m cube with just one element and applied this material model.
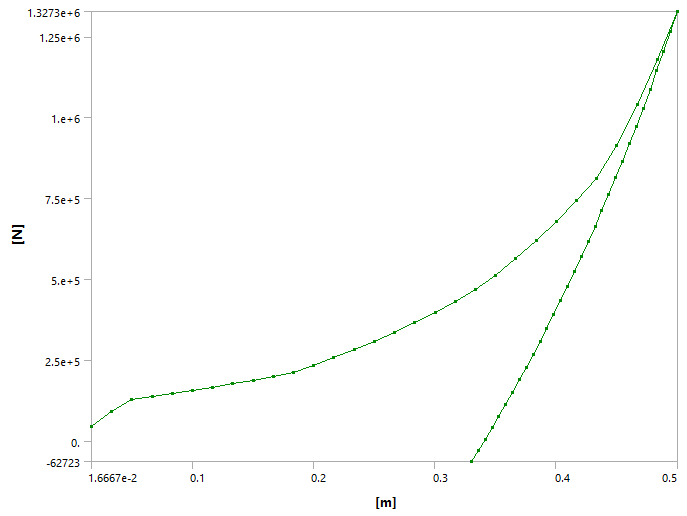
In a static structural model, I have zero normal displacement on three sides and compress one side to 0.5 m and plot the Force Reaction.
You can see that the reaction force has a linear elastic zone, then a plastic zone that gets more and more compacted. This is all created by the material model on one element. You can see that there is a large amount of permanent deformation = dissipation because when the direction reverses, the force goes to zero around 0.32 m.
If you want damping for a transient analysis, you could try a visco-plastic material model.
-
August 30, 2022 at 9:56 am
glasgowcer
SubscriberHi @peteroznewman! I really appreciate your support. Again, you are right regarding the plastic deformation but you already had the data for multilinear isotropic hardening in the model that I sent. For the visco-plastic material model that you suggest, it does not fit due to:
1.- Viscoplastic models are rate dependant so damping increases with time.
2.- Damping would be in both situations equal (compression/tensile) and the main problem here is the different behaviour of the material (it can de broken because tensile but remains in position working under compression stress)
-
-
August 30, 2022 at 5:30 pm
peteroznewman
SubscriberI took your Transient Structural model and cut the geometry into a quarter model and put symmetry boundary conditions on the two cut planes. I changed the bottom solid to a surface and made that a rigid body instead. I also meshed the solids with Linear elements to reduce the computation time. I simulated 5 ms of time.
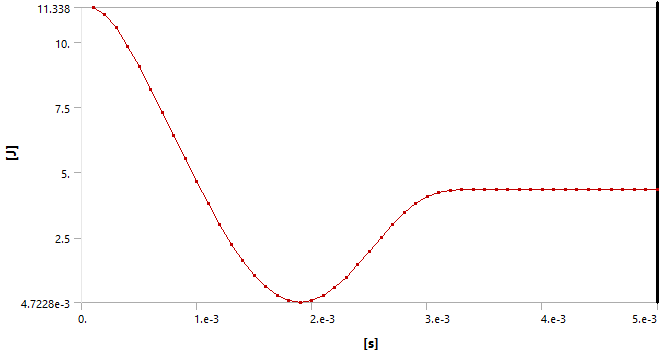
I applied my EPS20 multilinear isotropic hardening plasticity model (which is significantly different to yours) to the block. The magnesium block has an initial velocity of -4.34 m/s. Here is the displacement, velocity and kinetic energy graphs of the magnesium block.
Note that the Mg block has returned to the initial zero position at 4.3 ms
Note that the Mg block lost most of its velocity due to the plastic work it did on the EPS20 block. Its upward velocity is only 2.77 m/s but it started with an initial downward velocity of 4.34. Convert these velocities with the mass of the Mg block and plot the kinetic energy of the Mg block. Note that the Mg block started at 11.34 J and ended at 4.33 J so the EPS20 block absorbed 62% of the energy.
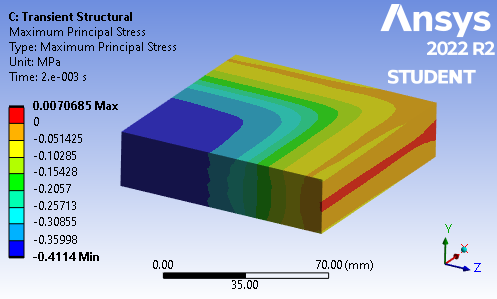
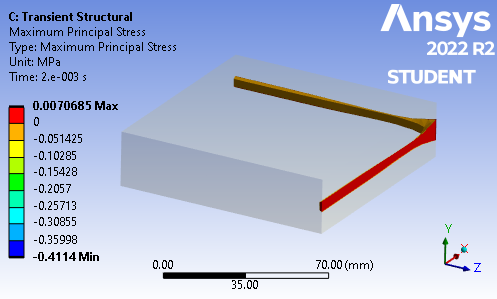
These results show that the plasticity material model can dissipate energy in a Transient Structural model. The model you provided is dominated by compressive stress. The maximum value of the Maximum Principal Stress is practically zero and limited to a few elements on the edge. There are no significant tensile loads.
The Capped Isosurface shows the few elements that have gone into tension. All the other elements are in compression.
-
August 31, 2022 at 4:18 pm
glasgowcer
SubscriberHi @PETEROZNEWMAN! You have done a really good job and my apologies if you get bored with me. I need to solve this matter so I promise you a virtual beers!
Please, could you kindly share your model with me or the results for some of the Design Points (according to my model):
And show the following results?:
- - Directional (Y) acceleration (Mg Block)
- - Maximum Shear Stress
- - Maximum Principal Stress
Thank you!!
-
September 6, 2022 at 5:39 pm
glasgowcer
SubscriberHi @PETEROZNEWMAN!
I made a couple of mistakes too.
1.- The graph I sent is “True strain” not “Engineering”, I wrote the wrong title. So you can take my data.
2.- We must discuss about SHEAR too, not only TENSILE, as I exposed at the beginning.
I simulated the material for the Design Points 51, 55,56,57, 58,59, 60 and the results are as following (see the file attached with results for the block C):
As you can see, the difference is huge, and the SHEAR limit is over-exceed. Remember that in my first post I indicated 0,33 MPa but I found some EPS manufacturers indicating around 0,13 MPa.
You can see the file here:
https://drive.google.com/file/d/15d3i2y90wGUjYK8j-HUXNM6J0weLF-Od/view?usp=sharing
Thank you!!!
-
September 6, 2022 at 11:18 pm
peteroznewman
SubscriberThe archive is 9.5 GB which will take hours to download. It would be better to archive without results (and without mesh) to get a very small file size that will download in seconds. Thanks.
-
September 7, 2022 at 7:01 am
glasgowcer
SubscriberI though it would better like this. You can leave it downloading during 1-2 hours (poor connection), otherwise simulation will take some days... In any case, see the link for the file as you request:
https://drive.google.com/file/d/1l_9RNkoHPe4qhRfZ7-kxKGy5NBNzbWzo/view?usp=sharing
-
September 7, 2022 at 11:03 pm
peteroznewman
SubscriberI made three attempts to download the 9.5 GB archive and each time an error occurred and I got no file.
I downloaded the 1.5 MB archive and solved it in 4 hours. I noticed that you didn't take advantage of the symmetry I used in my version of your file. I also switched to linear elements and that model solved in about an hour.
I will look at this some more over the next few days and might have something else to say.
-
September 21, 2022 at 7:40 am
glasgowcer
SubscriberHi @PETEROZNEWMAN! any update? Thank you!!
-
-
-
August 31, 2022 at 11:20 pm
peteroznewman
SubscriberHere is a link to the Transient Structural model that has the graphs I showed above. It still has your Parameter set intact for the geometry.
https://jmp.sh/7tpvkWy
-
September 4, 2022 at 12:23 am
peteroznewman
SubscriberI spent some more time converting Engineering Stress and Strain to True Stress and Plastic Strain. Last week, I used a YouTube video from an Abaqus user. Today I watched the Ansys How To video on Metal Plasticity. /courses/index.php/courses/topics-in-metal-plasticity/
As I revised my spreadsheet, I found a mistake. When I did the copy/paste of the stress from column E to column G, I didn’t paste the values, but the formulas, so I got the wrong numbers in that column! You will want to revise the values in your model if you copied this mistake.
-
- The topic ‘Tensile Erosion and Compression residual capacity’ is closed to new replies.


-
4708
-
1565
-
1386
-
1242
-
1021

© 2026 Copyright ANSYS, Inc. All rights reserved.

