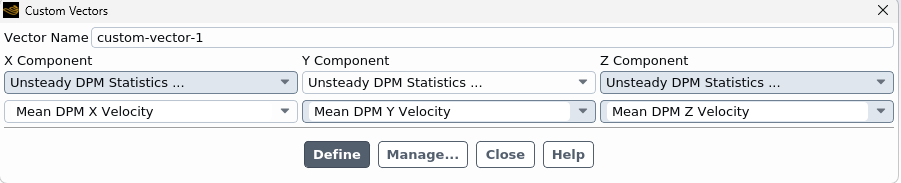
Fluids

Fluids

Topics related to Fluent, CFX, Turbogrid and more.

Taking time average of DPM quantities

    • scabo
      Subscriber

      Hi

      I am running an unsteady DPM simulation. I want to average the particle properties, like vectors of velocity, contour plots, etc. on the pipe cross-section over a period of time. How and where shall I do it? Is it possible to do it in Fluent/CFDPost or Paraview?

      2. Also my flow is converging at a point inside the pipe but the particle proeprties like vel magnitude or dpm conc. is not converging even when i run for 30s of real time. What could be the issue?

      thanks

    • Rob
      Forum Moderator

      If you mean the contours generated on surfaces of DPM Variables then creating a Custom Field Function of the value of interest and then using the time statistics in the Solve>Iterate panel should work to get the average and then you plot that on a surface. 

      I have no idea regarding the second point, but are the values showing repeating pattern (ie it's transient)? 

    • scabo
      Subscriber


      Hi-thanks for reply. Are you talking about turning on the Data Sampling for Time Statistics box on? If I do this, then in Results i should get the time averaged quantities? Secondly, I was talking of vectors of time-averaged velocity for a period of time. After doing unsteady statistics, I could not transfer the DPM vectors into CFDPost or Paraview because they are not comptible-so is Fluent the only option?


      2. I have seeing some repeating patterns but the difference is sometimes quite large to say that it is converging at some value. I have attached the convergence result for dpm velocity mag (y axis) vs iteration(x axis) for unsteady solver. Is this converging or do I need to continue further?


    • Rob
      Forum Moderator

      The time averaged data is for scalar fields, and is as you think. You can plot RMS-particle-x-velocity but not the RMS-particle-vector. It's likely Fluent only unless you add those CFFs/RMS fields to the .cdat file. 

      If the model is transient then iteration number is meaningless, if it's steady state then the particle update frequency may play a part in the convergence. Given the plot is also not an averaged value it's difficult to read. 

    • scabo
      Subscriber

      Hi-I have attached a new result which gives dpm concentration(y axis) vs time (x axis) at a given point in the domain. Is the convergence looking okay? By average do you mean taking time average over specific perioid of time and then plot with time? like 2-5s, 5-8s, 8-11s, and then plot it?

    • Rob
      Forum Moderator

      Each point being at a different time step? 

    • scabo
      Subscriber

      This result is at a given point in pipe. Yes each point on the graph is at different time-step or flow time. I have given the time-step=0.001 for flow and 0.0001 for particles. Is this procedure correct for monitoring flow convergence?

Viewing 6 reply threads
  • You must be logged in to reply to this topic.