-
-
July 10, 2024 at 3:50 am
sunmok2010
SubscriberHello, I'm sunmok kwon.
Actually, I'm taking the simulation about the transmittance(T) of Borofloat33 glass.
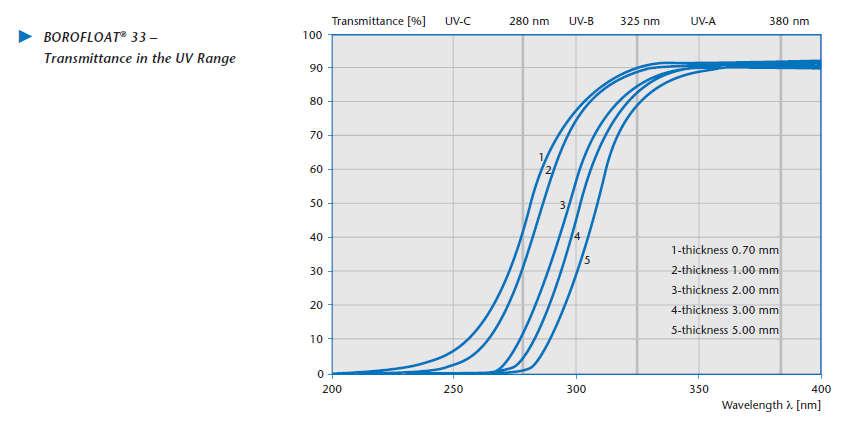
Actually, the graph about Borofloat 33 glass specification in the range of 200 to 400 nm is like below.
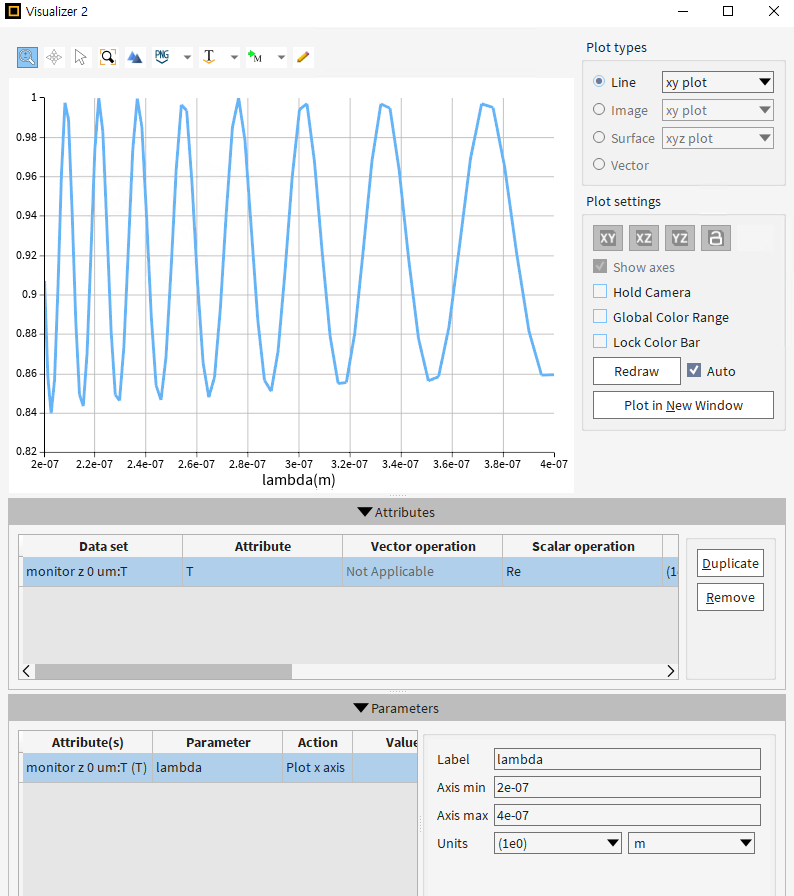
However, the simulation transmittance(T) graph is like below.
Actually, T graph result in the simulation is not matched with T graph result in the specification. To make the simulation result similar to the specification T graph result, I tried three things.
- Increasing the simulation time(fs) from 1300fs to 2000fs, 5000fs, 10000fs, 20000fs
- Increasing the frequency point from 9 to 79
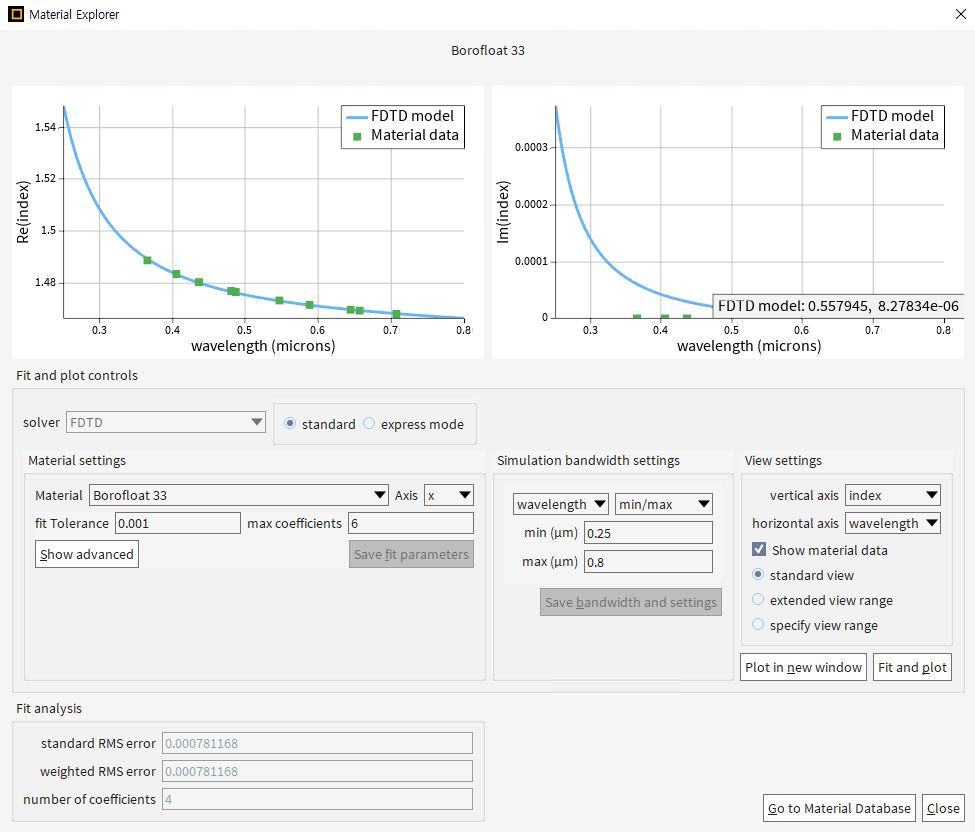
- making material data well fitted like below

Unfortunately, the simulation T graph still shows sine graph. I want to get the simulation T graph result similar to the specification T graph. Please tell me how to do that. Thank you!
-
July 11, 2024 at 5:45 pm
Guilin Sun
Ansys EmployeeI guess the first graph is the result from air-Borofloat33, whereas your simulation is from a slab of Boroloat33 in air, which is a cavity due to the two material interfaces. This could be due to the fact that you either indeed simulated a slab, or PML fails to perform.
Please check and make sure the Borofloat33 is extended outside of PML, and the PML is half wavelength away from the single air-Borofloat33 interface. If you still have questions, please paste some screencopes of your simulation settings.
-
- The topic ‘T graph about Borofloat33 glass isn’t coincident with Borofloat33 specification.’ is closed to new replies.


-
4778
-
1565
-
1386
-
1242
-
1021

© 2026 Copyright ANSYS, Inc. All rights reserved.


