We have an exciting announcement about badges coming in May 2025. Until then, we will temporarily stop issuing new badges for course completions and certifications. However, all completions will be recorded and fulfilled after May 2025.
Photonics

Photonics

Topics related to Lumerical and more.

SPAR calculate in INTERCONNECT

    • pengzheng97
      Subscriber

      Hi,

      I made a signal transmission system like below, but i found the signal after the "SPAR" module, the calculated results differ from those obtained in MATLAB. I have ensured that the input signals to "SPAR" in both MATLAB and INTERCONNECT are identical, and the S-parameter settings are also the same. However, as shown in the figure below, the results are misaligned in time for a few samples and then seem to recover later.

      Could anyone explain what might be causing this discrepancy?
      I would greatly appreciate your insights.


    • Dimitris Polyzos
      Ansys Employee

      Hello, 

      It is kind of tricky to guess why is this happening without checking the model on my PC.

      As you correctly point out both signals are in phase at high frequency of the spectrum. I reckon this happens due to the central frequency of the Source which is 193.1 THz. The phase change is around this frequency and if you notice at low frequencies it starts to have a deviation with the imported data. Maybe, a resampling is needed. Coudl you please let me know which OOSC are compared in your second photo?

      Regards

      Dimitris

      • pengzheng97
        Subscriber

        Hi,

        thanks for your reply, sorry I didn't explain it clearly. The orange line in Figure 2 is the result of OOSC_5 in the time domain, and the other blue line is the S parameter result I calculated numerically using matlab.

        There is some difference between the two. I made sure that the input signals are the same, so I don't know where the difference comes from. I hope you can explain it to me.

        Thanks again 

    • Dimitris Polyzos
      Ansys Employee

      Hello,

      Thanks for your reply. It is difficult to say for sure what is going on and why you get this offset whihtout ckecking the model.

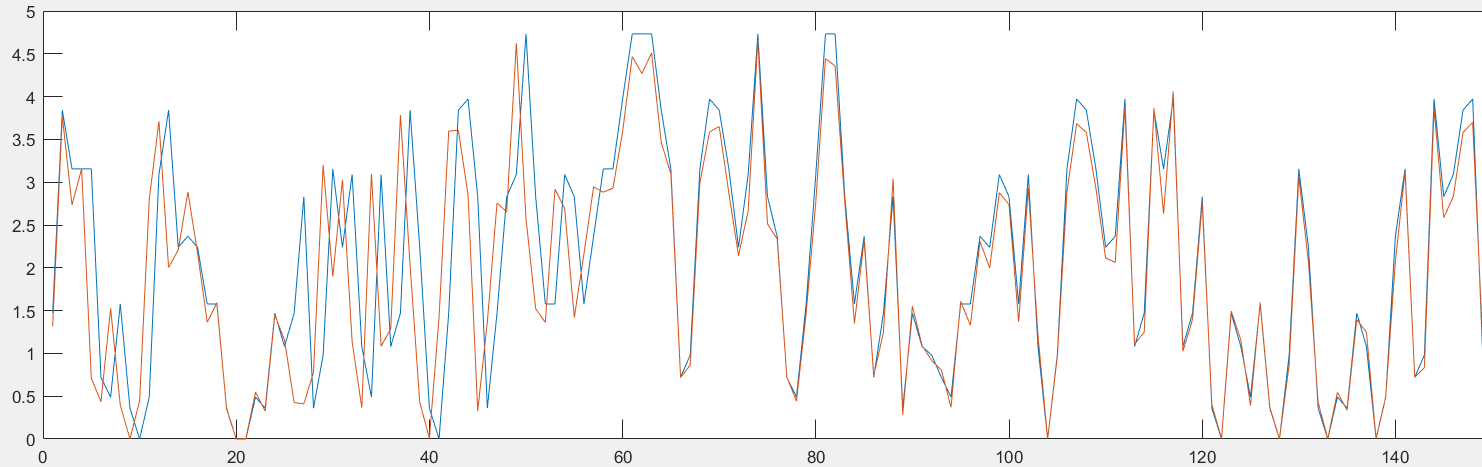
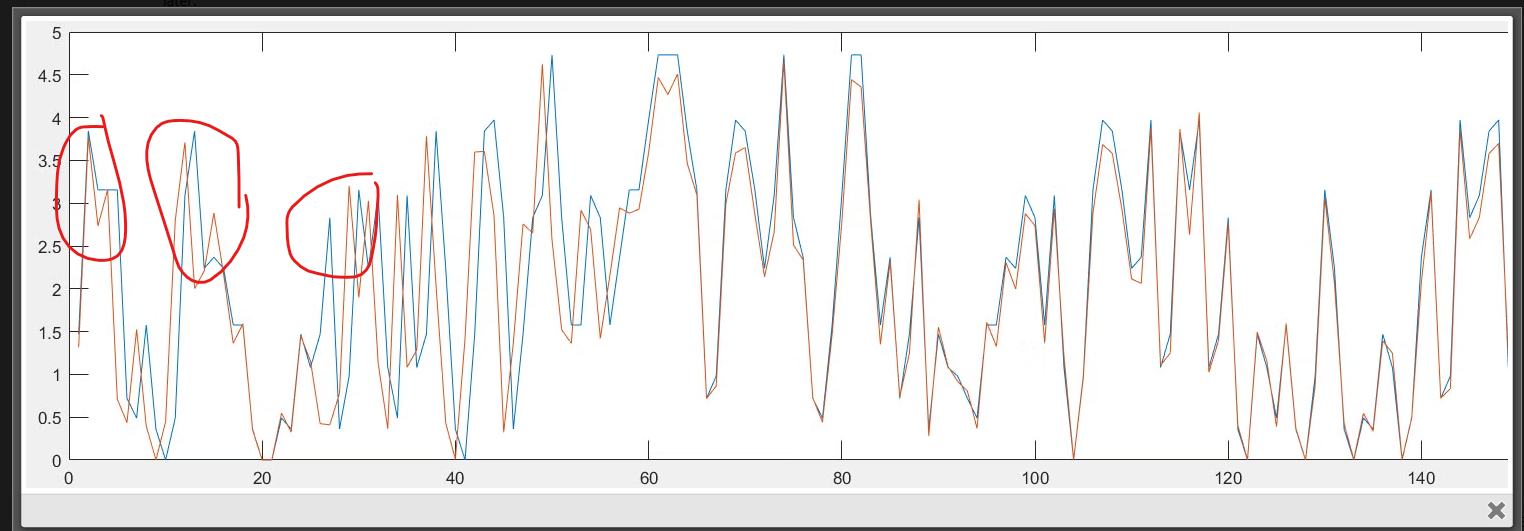
       However, I would recommend to do a test and change the central frequency of the Scripted source and check is this offset shifts alogn the x axis at the second photo you shared before. I reckon that you created the .dat file in matlab and imported in sparameter element. I think that INTC mode need resampling, try to increase the number of samples (sample rate) as there is a similarity in both blue, and orange, plots but I would not say that they are identical. even shifted both plots do not match each other exaclty as some peaks and valleys are not the same. 

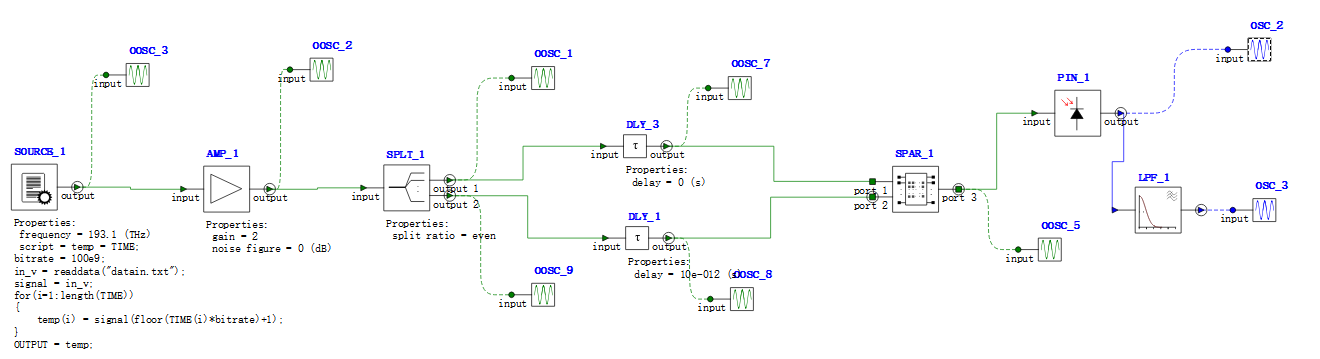
      S-parameter data contains the information on the transmission (and loss) of the signal as it passes through the element. In a time domain simulation, which is the case here, a digital filter will be fit to the S-parameters to try to replicate the impulse response of the given S-parameter data.

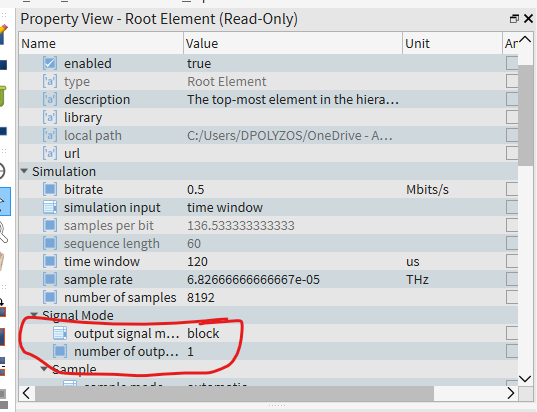
      Do you use sample or block mode in the Signal mode? Regarding the SPAR,  you could try tessting the IIR filter that tends to perform better for RLC circuits, especially if the phase is important. If you use the FIR filter it can fit the amplitude of the S-parameters well, but it also adds an artificial delay to the signal. I think your circuit is unidirectional, thus you can use  block mode to avoid the use of digital filters. In block mode, a Fourier transform of the signal is multiplied by the transfer function of the block to get the output signal instead of using a digital filter.

      I hope I helped.

      Regards

      Dimitris

Viewing 2 reply threads
  • You must be logged in to reply to this topic.