-
-
July 23, 2024 at 6:41 pm
S.S.S.ShankaVasuki
SubscriberHi,
I am trying to validate a single floating structure using ansys AQWA. I am using this article as a reference to which I am trying to validate my simulations - https://doi.org/10.3390/jmse9091028
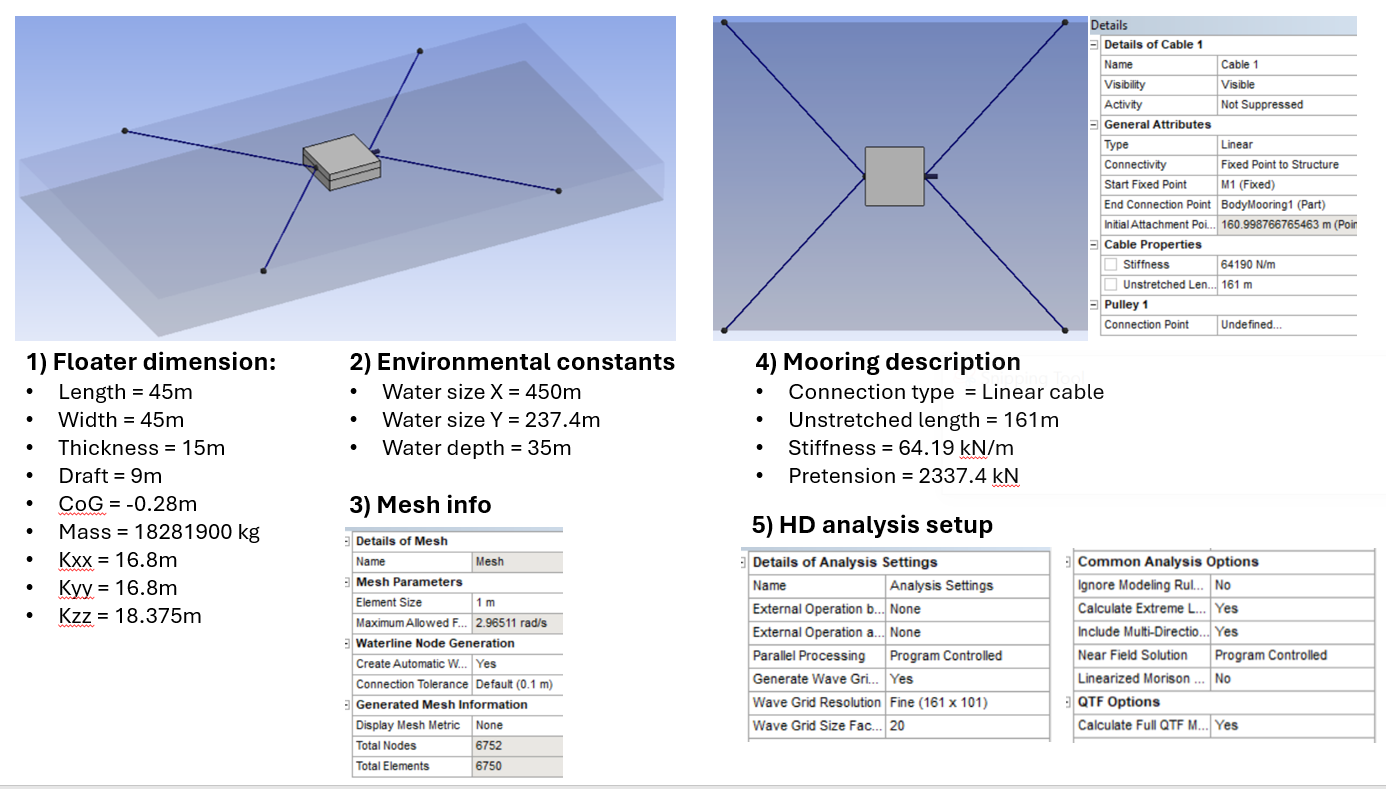
My simulation setup is as follows :-
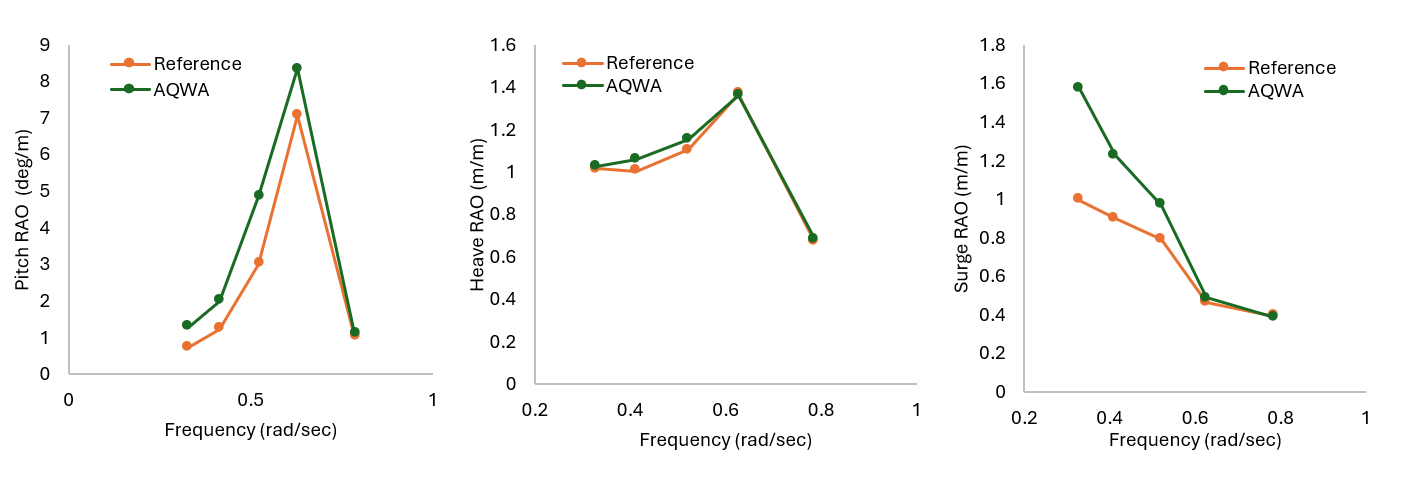
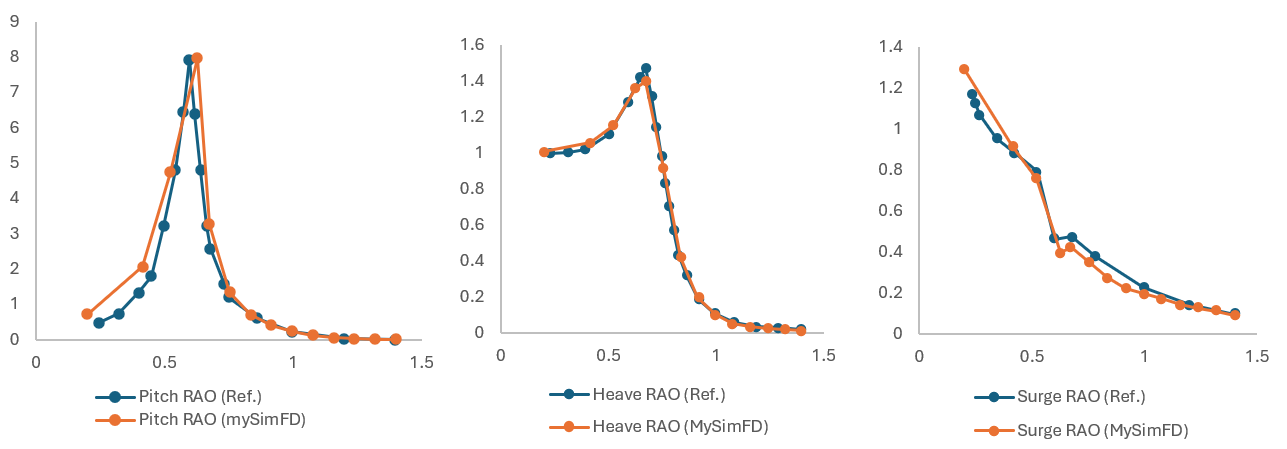
I am currently validating the results of the hydrodynamic diffraction through RAOs and the results are as follows:
As it can be seen from the plots, there is a clear difference with my simulations and the results from the reference article. I have ensured that the mass and interial properties are correct. I have also performed a mesh independence and a domain independent studies. Based on doing all these, I still get differences in the results and I have some questions regarding this which are as follows:
- What could be the cause of this difference in results?
- Do I have to include an additional damping matrix?
- How do I determine the damping matrix as the reference article does not mention it?
- Also for the mooring lines, I am not sure where I need to define the pretension of the cables because I dont find the option.
Please let me know what I am missing out and how to solve this issue.
Thanks!
-
July 24, 2024 at 2:41 pm
Shuangxing Du
Ansys EmployeeHydrodynamic DIffraction analysis does not directly include the mooring line effects. As there is no any hydrostatic stiffness for surge/sway and yaw motions, large differences of surge at low frequency may occur. Please check
(1) If the mooring line effects were included in the RAO calculation in the reference paper.
(2) If yes, please check the mooring configuration in the reference paper. If the pretension is 223.7.4 kN, and the initial attachment position distance is 161m, the unstretched length of the linear cable should be (distance - pretension/stiffness) = 161 - 2337.4/64.19=124.6m.
(3) If the mooring line effects were included in RAO calulcation in the reference paper, please set the unstretched length of the cable to be 124.6m and run Hydrodynamic Response - Stability Analysis with a very small irregular wave significant wave height. The 6x6 mooring stiffness matrix can be output. Then please use this matrix in the Hydrodynamic Diffraction by importing/defining this matrix through Connection - Insert Connection - Connection Stiffness.
-
July 25, 2024 at 12:44 pm
S.S.S.ShankaVasuki
SubscriberHi,
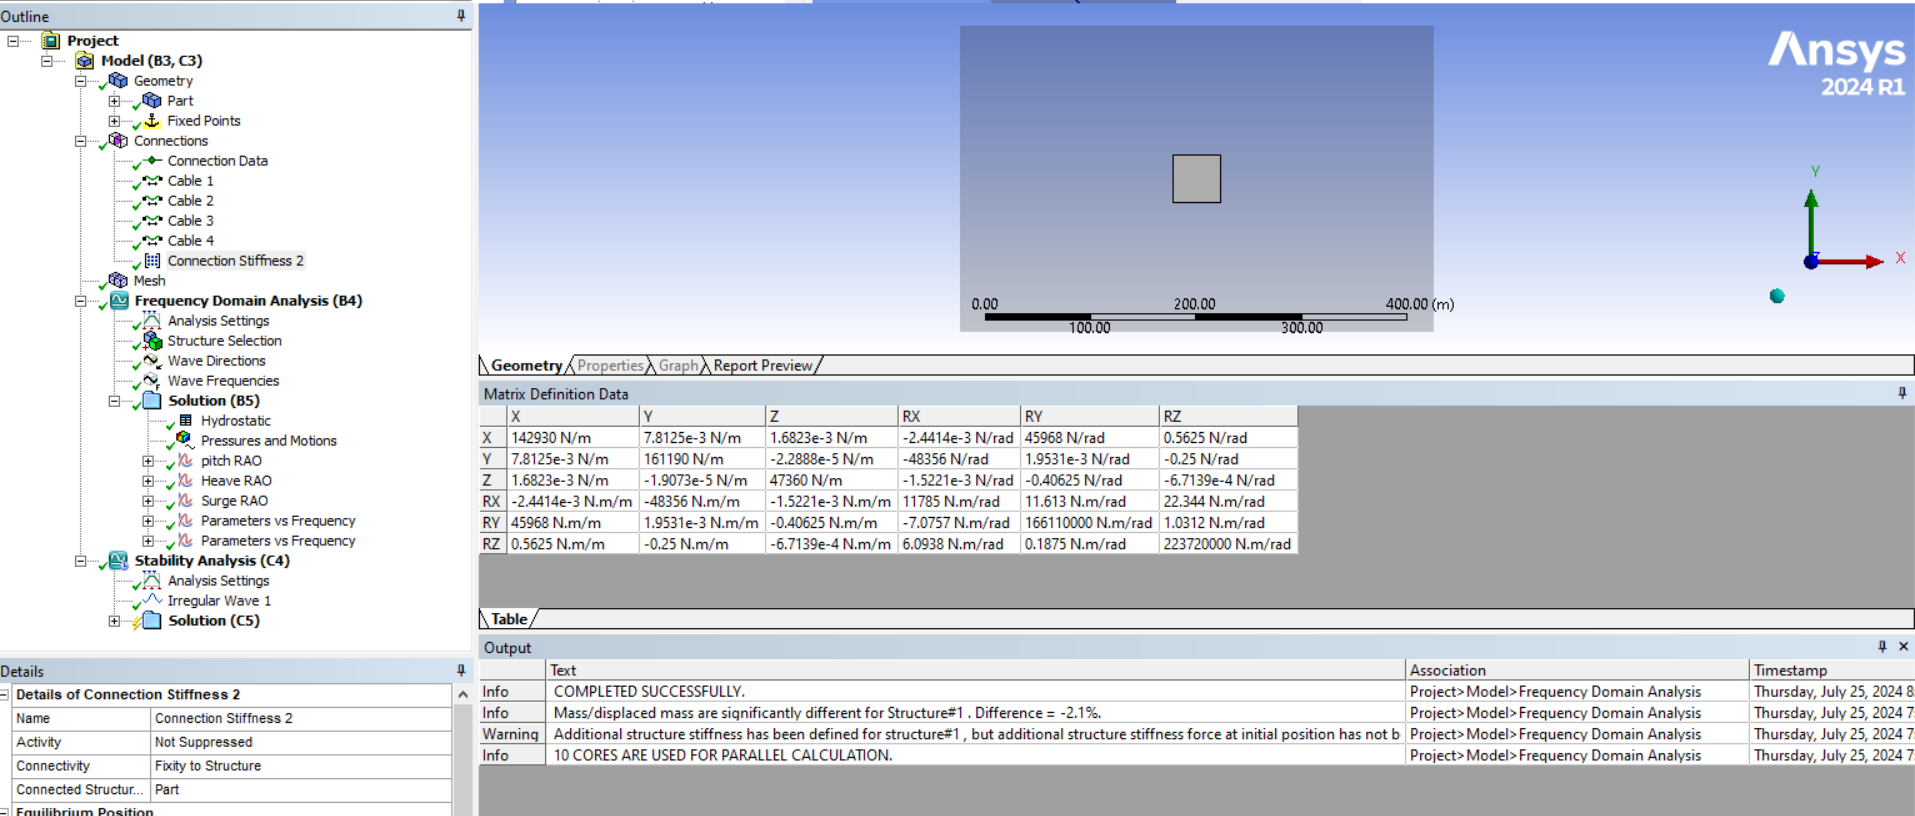
Thank you for the suggestions. I tried implementing all the sugesstion to my simulation and I followed this procedure as shown in the image:
From the above plots, the responses in pitch have been severly dampened and surge has increased. From these plots, it is clear that I am going wrong somewhere which I am not able to figure out. So I have some questions regarding this.
- Is the specification of the irregular wave correct? (if not could you suggest some values that I can use?)
- Have I used the correct mooring stiffness matrix from the correct output file?
- Do I need to include additional damping and additional added mass matrix in the simulation? As of now there are no additional mass/damping matrices defined as it can be seen in the image of point (5).
- Because in the Analysis.LIS file from the results of hydrodynamic diffraction, I get added mass and damping matrix at different frequencies. Do I have to enter them as additional damping matrix in part -> insert -> additional damping?
Please let me know where I am going wrong.
Thanks!
-
July 25, 2024 at 4:26 pm
Shuangxing Du
Ansys EmployeeThe rotation unit of the mooring stiffness for the rotational motions in the aqwa output file is in [radian]. If you import this matrix into AqwaWorkbench for the connection stiffness matrix, please make sure the unit in Aqwa project for angles is in [radian] instead of in [degree].
-
July 25, 2024 at 7:11 pm
S.S.S.ShankaVasuki
SubscriberHi,
I changed the units of the rotational motions to [radians] as shown in the figure below and these are the new updated the plots I get ( I have ensured the units are correct for the rotational motion in the plots):
What I now observed is that the trend of the variation is better but the values are still not correct. The pitch RAO near the natural frequency is too high and I am not sure what is happening with the surge RAO. I belive that AQWA does not take into account the effect of viscous damping and this might be the reason for this discrepancy? and it needs to be given as an input as additional damping. Maybe I should do that?
Hence, I have some similar questions as my last thread,
- Is the specification of the irregular wave correct? (if not could you suggest some values that I can use?)
- Do I need to include additional damping and additional added mass matrix in the simulation? As of now there are no additional mass/damping matrices defined.
- Because in the Analysis.LIS file from the results of hydrodynamic diffraction, I get added mass and damping matrix at different frequencies. Do I have to enter them as additional damping matrix in part -> insert -> additional damping?
Please let me know where I am going wrong.
Thanks!
-
July 29, 2024 at 12:50 pm
S.S.S.ShankaVasuki
SubscriberHi,
I have some update with this simulation. I ran both hydrodynamic diffraction (frequency domain) and hydrodynamic response (Time domain) analysis.
Note: The reference article used in this thread has also made use of Ansys AQWA and has provided the frequency dependent RAOs as a result of both frequency domain and time domain analysis and I am trying to validate the same (doi: https://doi.org/10.1016/j.oceaneng.2022.112754).
Hydrodynamic Diffraction (Frequency domain) analysis:
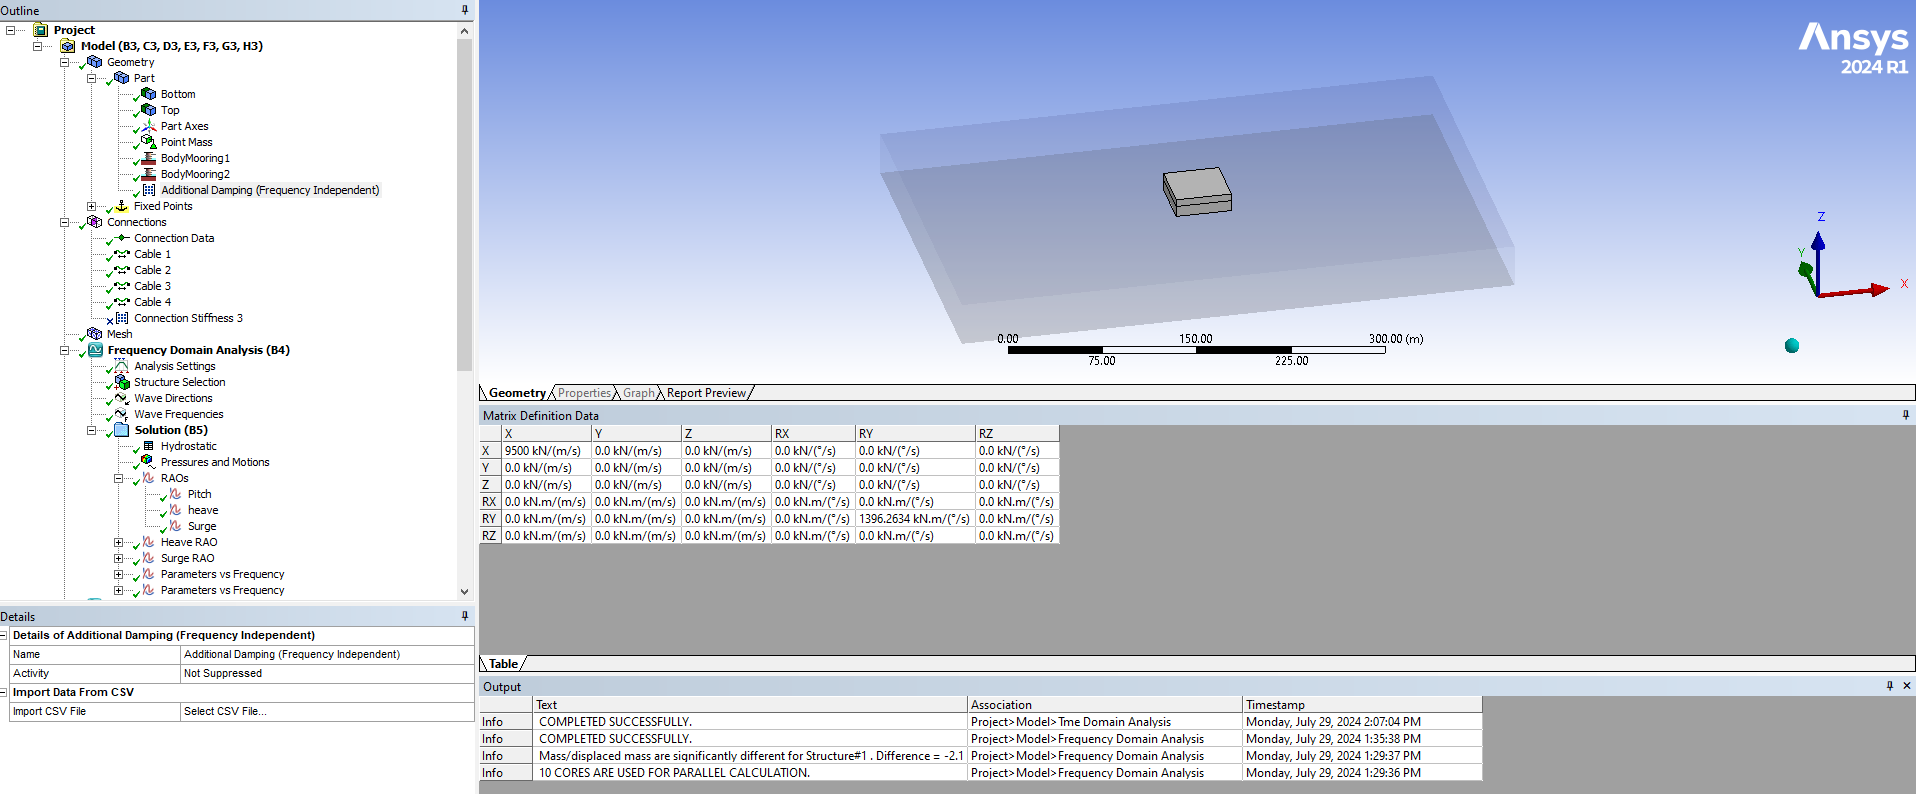
I did the following in the diffraction analysis.
- I removed the connection stiffness matrix from the HD simulation
- I added an additional damping matrix in the surge and the pitch DoF (as shown in the image below) as the paper used the PQ method to calculate the viscous damping matrix which is not considered in AQWA.
The result of the Diffraction analysis is as follows which now seems to be matching decently well:
Hydrodynamic Response (Time domain) analysis:
I used the following input parameters to evaluate the time response of this simulation. I ran 5 time domain simulations with regular, 2nd order stokes equation with different wave frequencies and amplitudes as follows:
Freq (rad/sec) Amplitude (m) 0.33 1.12 0.415 1.47 0.522 0.98 0.628 0.84 0.785 0.84 As a result, I extracted the RAOs from the time domain analysis as follows:
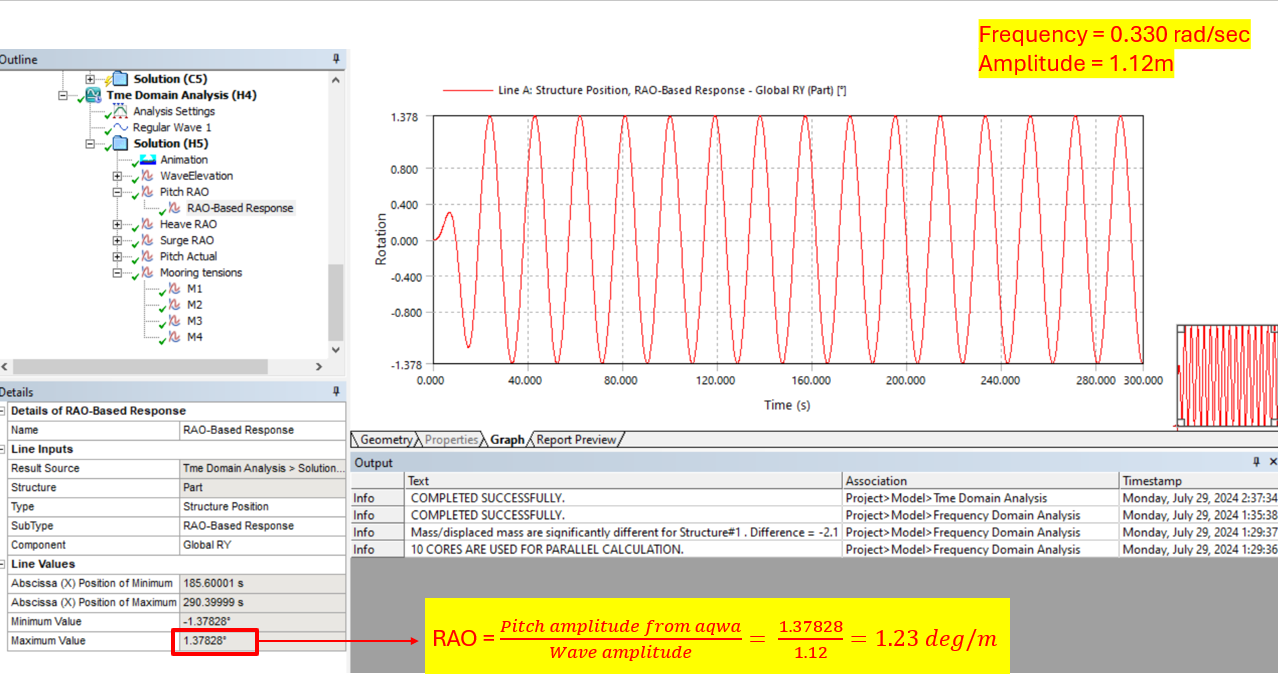
- I first plotted results by going through :– solution –> insert result –> structure motions –> strucutre position –> RAO-based response
- Then Calculated the RAO as the ratio of pitch amplitude from AQWA to the wave amplitude as shown in the image below
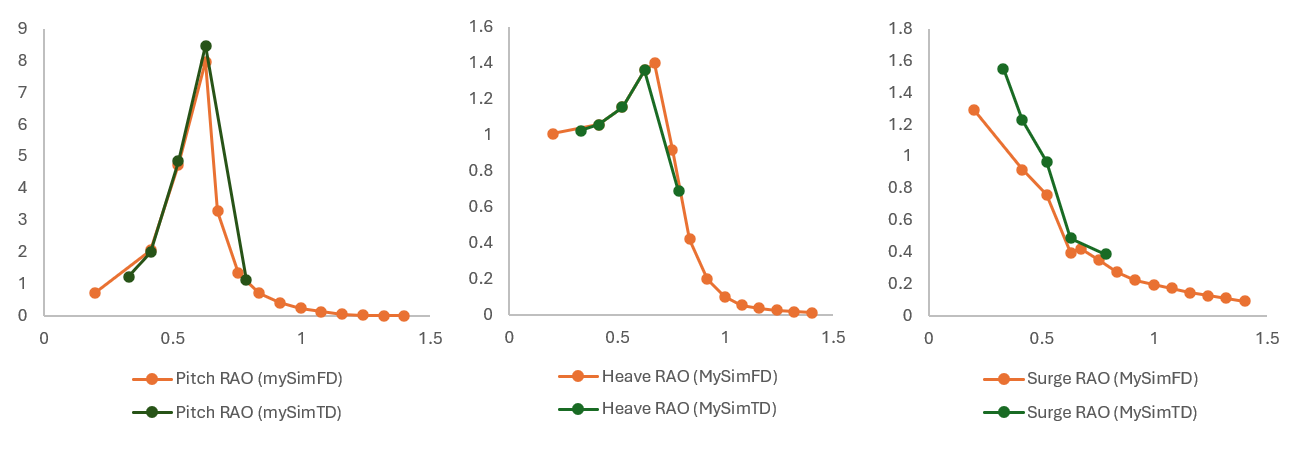
I did the same for all the frequencies for pitch, heave and surge and I compared the results with the RAOs I obtained using the diffraction analysis. From the plots below the variation of surge is significant compared to heave and pitch.
Based on these results I have some questions which needs some clarification:
- When the results from the diffraction analysis is matching the reference why is the results from the hydrodynamic response analysis not matching?
- Why I am getting huge differences in the surge motions in the HR analysis?
- What am I missing in the hydrodynamic response analysis?
- Also in the hydrodynamic response analysis, the RAO based response is in [deg] although its RAO, should it be [deg/m]?
- What do the different responses mean – RAO-Based Response, Low-Frequency Based Response, Wave Frequency Based Response, Actual Response?
- Also, in the end how do I know if my simulation is correct? because the RAOs match in the HD analysis but they dont in HR analysis, So I dont know what is wrong.
I kindly please ask you to answer all of the above questions because I have spent a lot of time trying to solve this problem and not able to validate it. Please help me out with this.
Thanks
-
July 30, 2024 at 9:24 am
Shuangxing Du
Ansys Employee(1) The regular wave time domain analysis includes the nonlinear Froude-Krylov force and the hydrostiatic force. As shown below, the RAO based reposne is defined, which also depends on the COG position in the time domain. I wonder if the RAO based respones could be closer to the frequency domain results when you use smaller wave amplitudes.
(2) The big differences of surge at low frequency for a freely floating structure may be possible, as there is no hydrostatic stiffness for any horizontal motion degrees of freedom (i.e. surge, sway, and yaw).
(3) Is the additional damping matrix included in your time domain analysis?
(4) Yes, the outputs of the rotational motion responses are in degree. Their RAOs are in [deg/m].
(5) The RAO-Based Response has been explained above. Based on the actual motion responses, the low pass filter is used to have the low-frequency responses. The wave frequency response is the difference between the actual response and the low-frequency response. Please see Aqwa theory manual, Section 13.5.3.
(6) When the wave amplitude is small, the time domain responses should be close to the frequency domain results of which the small amplitude of motion assumation is applied. The time domain analysis may include some nonlinear effects, such as nonlinear Froude-Krylov force and hydrostatic force, nonlinear wave theory (such as 2nd order Stokes waves) or the second order difference frequency and/or sum frequency wave forces, and drag forces if defined. They make differences when the wave amplitudes are not small.
-
July 30, 2024 at 9:38 am
S.S.S.ShankaVasuki
SubscriberHi Sxdu,
Thank you for your response. I shall keep these points in mind. I have some questions with respect to points (2) and (3)
(2) But I believe that mooring lines would restrict the motion in surge, sway, and yaw right as the motion in sway and yaw are nearly negligible in my time domain actual response. Only the surge seems to be a bit higher than the values shown in the reference article.
(3) regarding including the additional damping matrix in the time domain analysis. How exactly is it done because as of now, I have just defined in it :- part -> insert -> additional damping.
I am not sure on how to include the additional damping in the time domain analysis, could you please let me know how to do it because I feel this might be the cause of the difference.
Please let me know.
Thank you!
-
July 30, 2024 at 10:41 am
Shuangxing Du
Ansys Employee(1) Please check and compare the actual responses with the Hydrodynamic Diffraction RAOs if the mooring lines are included. Please also use smaller wave amplitudes. If the wave direction is 0 or 180 degrees, and the structure and mooring configuration are port-starboard symmetric, the sway and yaw motions should be very small.
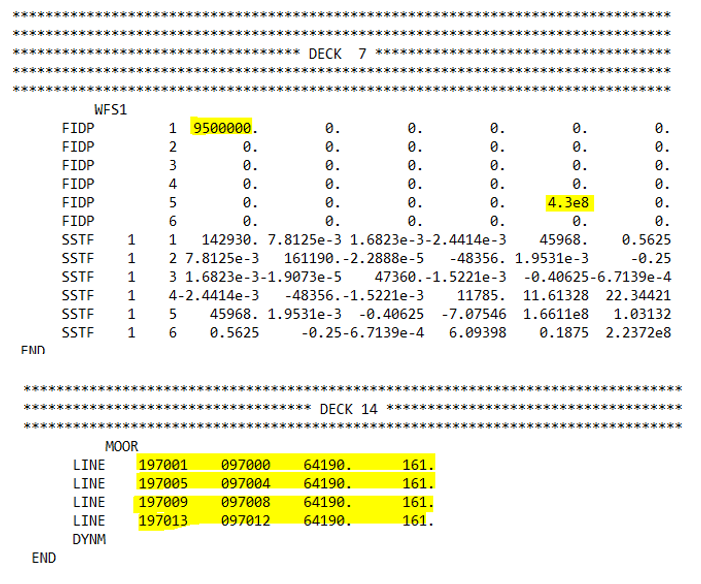
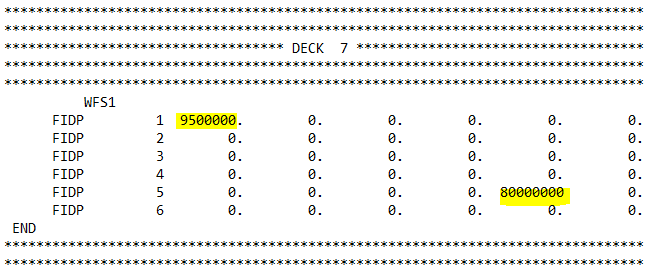
(2) Please check the input data file of TimeResponse.dat in the subfolder of your project working folder. The frequency-independent damping matrix should be in the Data Category 7 with the key word of FIDP (see Aqwa reference, section 11.6.1) if it is included. The mooring definition is in Data Category 14 in this input data file.
11.6.1. The FIAM/FIDP Data Record - Frequency Independent Added Mass/Damping Matrices
-
July 30, 2024 at 11:27 am
S.S.S.ShankaVasuki
SubscriberHi,
Thanks for the reply.
(1)
- When you say compare the actual responses with the diffraction RAOs do you mean I calculate the RAO of the time domain analysis as follows - RAO_TD = (Maximum motion amplitude using the "actual" response from aqwa) / (wave amplitude)?
- When you say including mooring lines, do you mean including the connection stiffness matrix in the diffraction analysis? Or do you mean something else?
- Regarding the wave amplitudes, these are the values mentioned in the reference paper.
(2) I checked the input files and both the additional damping matrix and the mooring line definitions seems to be considered in the time domain analysis as shown in the images below.
I think I have checked all the factors and everything seems to be alright. But yet, the time domain results from my simulation and that of the reference article do not match. Only the frequency domain seems to match as shown in the figure (in this fig, wave frequency is 0.33 rad/sec and amplitude is 1.12m).
y axis - ("RAO based" response from aqwa) / (wave amplitude)
x- axis - Time (taken from 100 to 200 seconds from aqwa to ignore the wave development region)
I am not sure on what I am missing because I think I have tried many things but the time domain responses of the pitch and the surge response dont seem to match with the reference at all even after adding the addtional damping.
It is suprising that the effect of damping is shown in the diffraction analysis clearly but that does seem to work for the time domain analysis even after considering it.
Do you have any other suggestion that I could try?
-
July 30, 2024 at 12:07 pm
Shuangxing Du
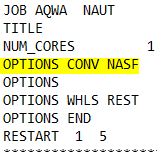
Ansys EmployeeIn the time domain, the data of the additional structural stiffness with SSTF may not be used by the option NASF. Please check if this option is included in your time domain analysis input data file. It is reasonable to exclude these data by this option, as the mooring lines are defined in the data category 14 with LINE data records.
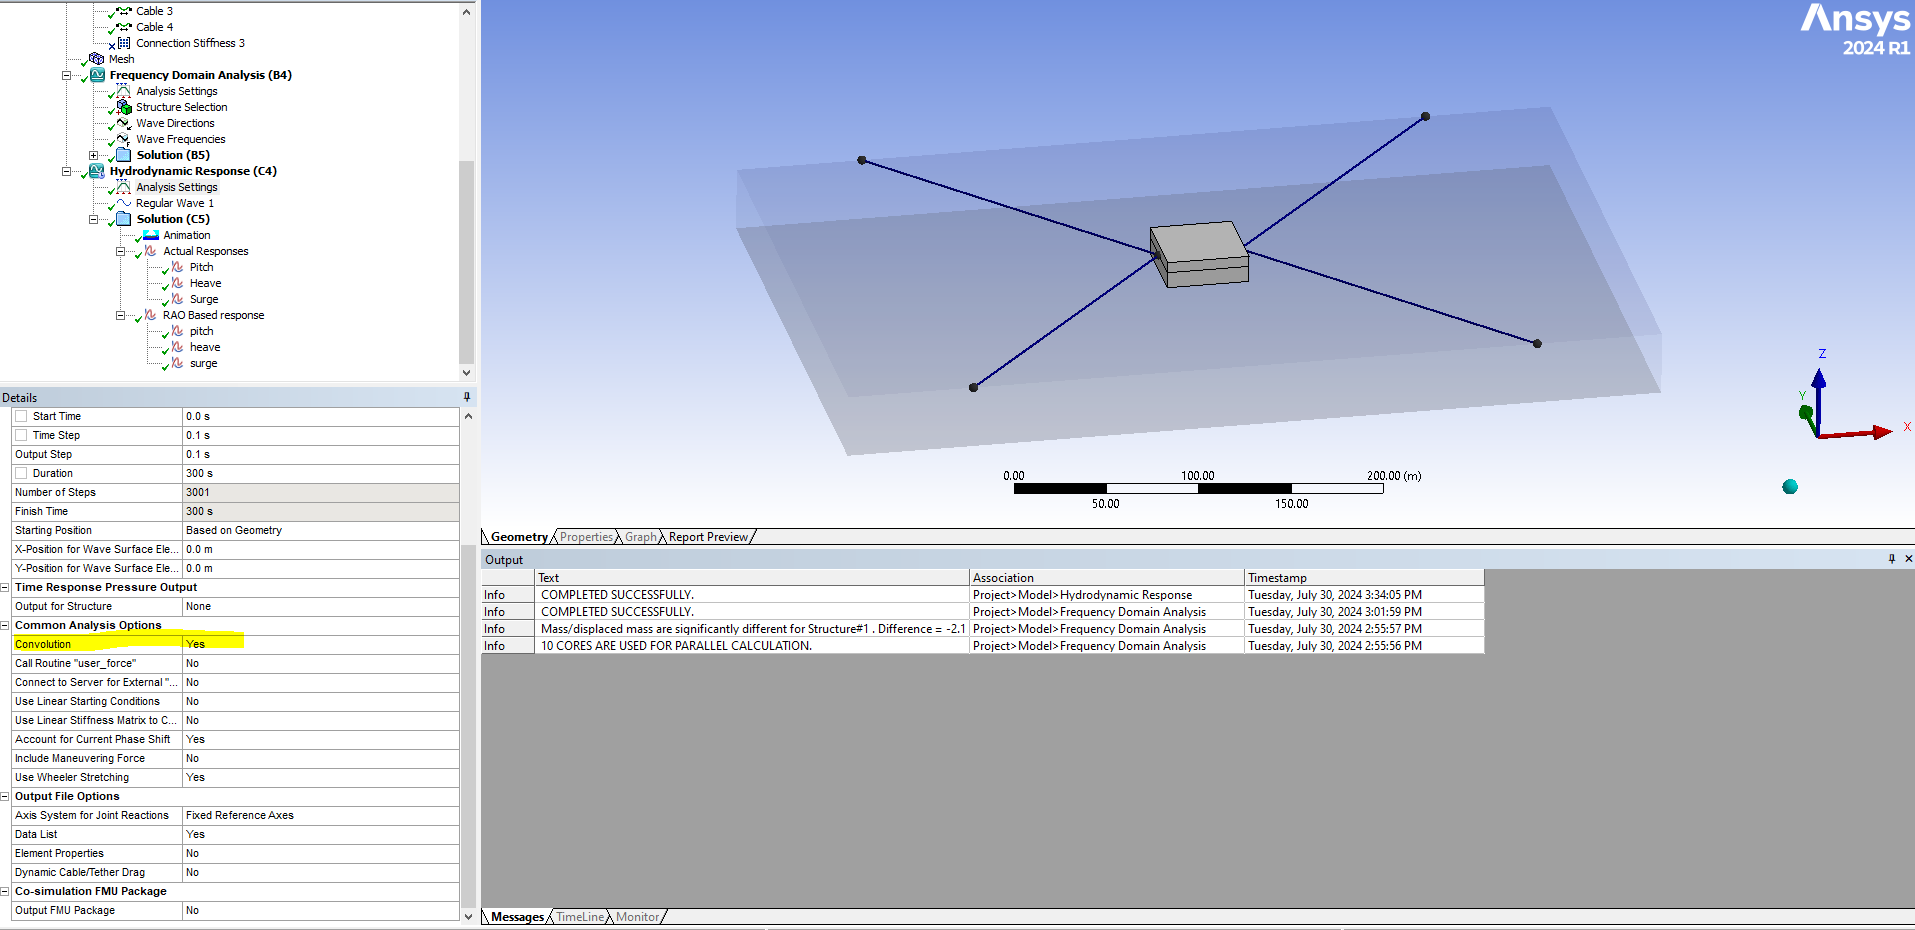
Please also check if CONV option exits in your time domain analysis. Could it be better to use RAO_TD = 0.5 * difference between the crest and trough of the actual response from aqwa / (wave amplitude)?
Once again, please try to use a smaller amplitude.
-
July 30, 2024 at 1:46 pm
S.S.S.ShankaVasuki
SubscriberHi,
Thank you for your response. Here are the observations.
1) The connection stiffness matrix is disabled in the diffraction analysis but as it is considered in the time domain analysis in the data category 14 with LINE data records as shown below. It clearly shows that the additional damping matrix is considered in the simulation. But the values in the RAO based response in the TD analysis does not change even if I change the damping matrix. Only the values for the actual response change. This is a bit strange. Does this mean that the additional damping has no effect in the time domain analysis?
2) The convolution option in the analysis setting is enbled (“yes”) as shown in the image. Is this the option you are referring to? or is there another option called CONV?
3) I tried your method of calculating the RAO as per the formula RAO_TD = (0.5 * difference between crest and trough)/ (wave amplitude) and I get the following results. The plot looks much better now. But could you explain why I need to use this formula?
4) I cannot use a smaller amplitude as the reference article mentions a particular amplitude for each of the frequencies. And if I reduce the amplitude, I might get better results, but I dont think that is the right way (please correct me if I am wrong).
The last and the only question that still persists is as to why is the actual response of the time domain analysis not matching with the reference article. I get higher pitch and surge responses as shown below (in this fig, wave frequency is 0.33 rad/sec and amplitude is 1.12m). Also I notice that the reference article has equal amplitude above and below the zero line where as in the actual response of my time domain analysis, I get unequal amplitude above and below the zero line. So I am not sure on how to match these plots. Because this is the last plot I need to validate and it would be nice if you could help me with this.
So is there anything else I can try to get a better match? :)
-
August 1, 2024 at 11:16 am
S.S.S.ShankaVasuki
SubscriberHi sxdu,
Could you please help me out with the previous questions?
Thank you!
-
August 6, 2024 at 9:36 am
S.S.S.ShankaVasuki
SubscriberHi sxdu,
Could you please help me out with the previous questions?
Thank you!
-
August 6, 2024 at 11:00 am
Shuangxing Du
Ansys EmployeeI am sorry that without input data files of yours and the reference paper, I cannot image where the differences come from.
-
August 6, 2024 at 11:13 am
S.S.S.ShankaVasuki
SubscriberPlease let me know on how I can share my input data files with you? Would the .DAT files be sufficient?
And you can find the reference article via this link: https://doi.org/10.1016/j.oceaneng.2022.112754
-
August 6, 2024 at 11:59 am
Shuangxing Du
Ansys EmployeeI can only read the abstract of the reference paper, in which the model seems to be a multi-structure system linked by joints and moorings.
-
August 6, 2024 at 12:04 pm
S.S.S.ShankaVasuki
SubscriberYou can use this link to access the full paper - https://file.io/RSD1gzyAi6yd
-
August 6, 2024 at 2:20 pm
Shuangxing Du
Ansys EmployeeThanks. I got the paper. Could you please send me your .dat files?
-
August 6, 2024 at 2:26 pm
S.S.S.ShankaVasuki
SubscriberThe .DAT files can be accessed through this link - https://file.io/NfHHczmnp7XW
-
August 6, 2024 at 3:43 pm
Shuangxing Du
Ansys EmployeeGot the input data files. Thanks.
-
August 7, 2024 at 8:28 am
Shuangxing Du
Ansys EmployeeThe Aqwa time domain results at 0.33 rad/s (T=19.039955s, head sea) seem normal, comparing to the RAOs generated by Hydrodynamic Diffraction. As shown below, the surge, heave and pitch RAOs (from HD) and responses (from HTR) are plotted. The amplitude of the time history of the pitch response is about 1.54 degrees, the equivalent RAO is about 1.54/1.12=1.375 degree/m, the interpolated pitch RAO by Hydrodynamic Diffraction at that frequency is greater than 1.0 degree/m. Please check the pitch time domain response of the reference paper. From the graph you showed on July 30, the amplitude of the time history of pitch response from the reference is about 0.8 degree, the equivalent RAO (if the wave amplitude is 1.12m) is about 0.7 degree/m.
-
August 7, 2024 at 8:46 am
S.S.S.ShankaVasuki
SubscriberHi,
Thank you for your reply!
So if i understand correctly,
- My time domain and Frequency domain analysis are correct? Right? Because they seem to match as what you have got.
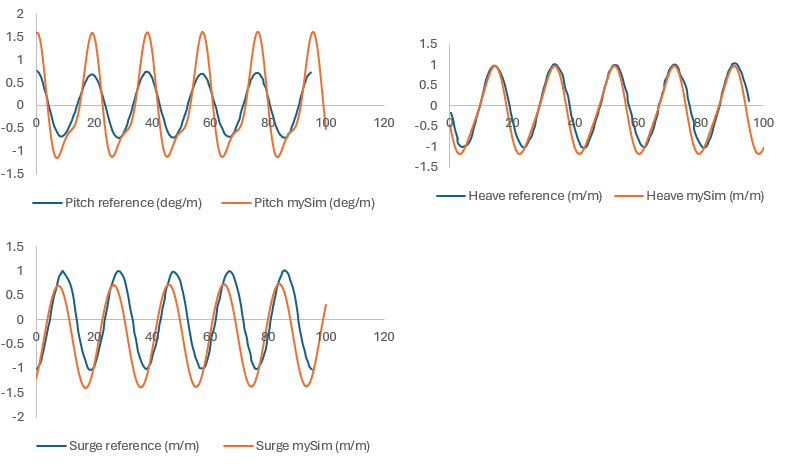
- I dont really understand the second part of your explaination where you talk about the time response of the reference paper. Could please explain it more elaborately? Because this is the comparison between my time domain analysis and of the reference article
-
August 7, 2024 at 9:49 am
Shuangxing Du
Ansys EmployeeThe amplitude of the blue line of pitch (reference) is about 0.8 deg (did you divided the reference results by the incident wave amplitude? If yes, it is 0.8 deg/m). But the RAO by HD at this frequency is greater than 1.0 deg/m.
-
August 7, 2024 at 9:54 am
S.S.S.ShankaVasuki
Subscriberthank you for response.
Yes the reference results are divided by the incident wave amplitude. I also found that the reference article's time domain RAO is lower than what they get using the diffraction analysis. So, do you suggest that there might be an error in the reference article with respect to these plots?
-
August 7, 2024 at 9:58 am
Shuangxing Du
Ansys EmployeeHas answered.
-
August 7, 2024 at 9:59 am
S.S.S.ShankaVasuki
SubscriberSorry, do you mean that my simulation is correct and the reference has an error?
-
August 7, 2024 at 10:15 am
Shuangxing Du
Ansys EmployeeI just mean that your time domain results at this frequency are closer to the RAOs in the Hydrodynamic Diffraction analysis.
-
September 13, 2024 at 10:32 am
S.S.S.ShankaVasuki
SubscriberHi,
I have a question regarding the mooring line calculations as you mentioned in your post on July 24th. You mentioned an equation to calculate the unstretched length which is as follows:Unstretched length = initial attachment point distance - (Pretension/stiffness)
Could you explain this in more detail? Because I imagined that the unstretched length to be the longest but from this equation, the initial attachment point distance seems to always be larger than the unstretched length.
-
- The topic ‘Single floating structure Ansys AQWA’ is closed to new replies.


-
4969
-
1645
-
1386
-
1242
-
1021

© 2026 Copyright ANSYS, Inc. All rights reserved.

