-
-
November 9, 2023 at 12:04 pm
henrique.geraissate
SubscriberDear community,
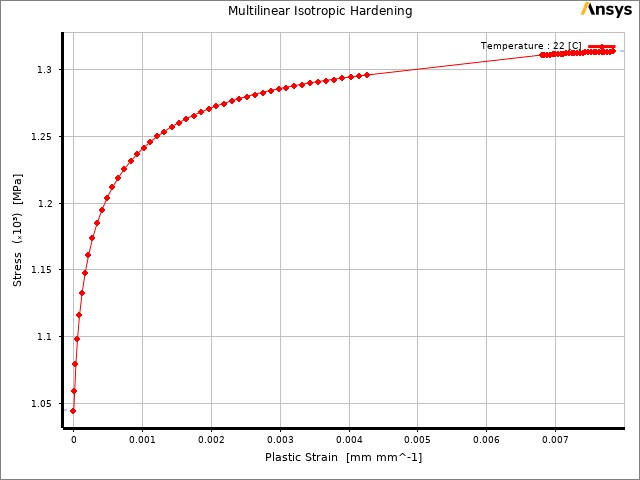
I have received raw data from a tensile test of a hardened stainless steel and I would like to use that data in Mechanical. I saw a very nice tutorial from Ansys on how to do it and followed all the steps to extract a data set of true stress x true plastic strain, so I could input it into a Multilinear Isotropic Hardening model.
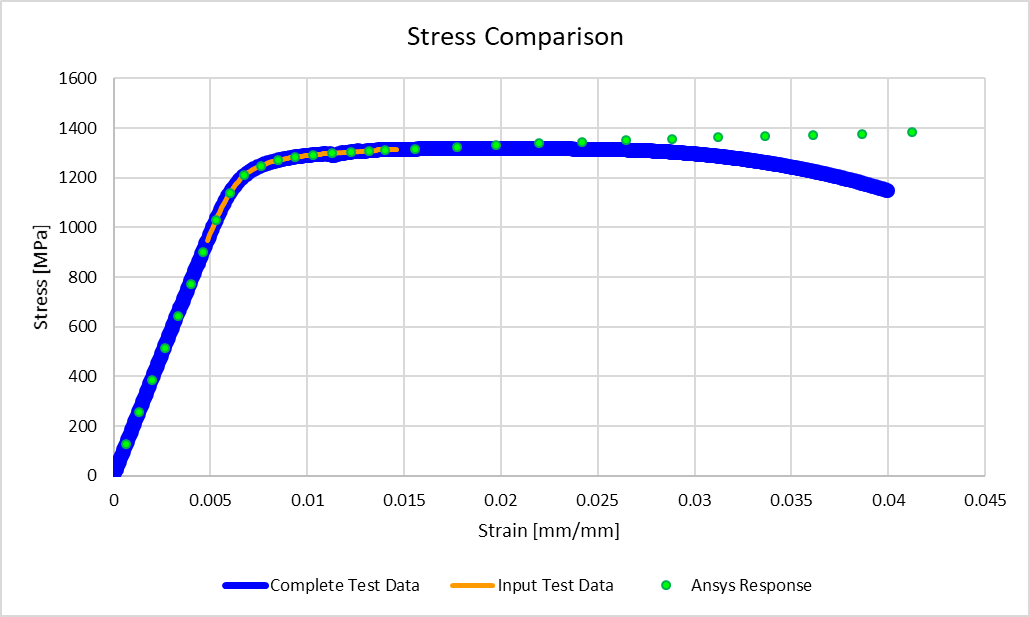
Then I created a model of the specimen used in the test and simulated the test conditions (one end fixed, one end with displacement BC), in order to verify if the response from Ansys would really correspond to the data I used as input. One can see in the chart below that it correlated pretty well.
Although this is looking fine, there are two things that I don't understand:
- Why is the stress still increasing after the last input data point? I thought that Ansys did not extrapolate the data, but rather it would consider a perfectly plastic behavior from that point onwards (no stress increase with increasing strain).
- Looking at the deformed model (picture below), one can notice 3 necking areas showing up simultaneously. I was expecting just a single necking region in the center of the specimen. I am not sure if this could be an indication of flaws on the material model, or on the FE model, or in the physics setup.
I am looking forward to hearing your impressions on that topic! :)
Kind regards,
Henrique -
November 9, 2023 at 2:06 pm
Armin
Ansys EmployeeHi Henrique,
The discrepancy between your model and experiment is related to the hardening curve after plastic localization (necking), as you have a pretty good agreement until ~1% strain before necking. It is a good practice to provide hardening data of the material after necking and there are some techniques available to obtain post-necking hardening response of materials. I would suggest that you check the paper below for reference.
Also, I would suggest that you model only 1/4 of the specimen and employ symmetry boundary conditions. That may solve the multiple necking issue.
https://www.sciencedirect.com/science/article/pii/S2666359722000208
-
November 10, 2023 at 12:47 pm
henrique.geraissate
SubscriberHello Armin,
Thank you very much for your answer and reference paper!
From the tutorial I saw, I understood that the MIH material model did not accept negative slopes in its definition. That's the reason why I have input data only up to the necking point. Now I was reading through the Mechanical APDL manual, and I saw that this is really the case, except if you define the Material via APDL. The manual says that issuing the command TBEO ,NEGSLOPE,1 should do the trick, but it continues by creating the input table via APDL.
In my case I have a large set of data points, and I think this would be a really tedious task and also more prone to errors. Do you perhaps know if there is a way of defining after necking behavior (negative slopes) in the Engineering Data Source GUI?
As for using the 1/4 symmetry in the model, it resulted in the exact same behavior as the full model (which I think is a good think to be honest hehe). So the multiple necking regions are still there:
I would be really happy to hear further ideas on that also.
Cheers,
Henrique
-
-
November 10, 2023 at 2:11 pm
Armin
Ansys EmployeeHi Henrique,
If you have a large number of data points, I suggest that you select a functional form, like power-law or Voce function, to fit it to your data and then let that function predict the large strain behavior and adjust if necessary. It will not predict a negative slope, but the hardening may saturate at larger strains (particularly for Voce function) and you'll see a negative slope in your resulting force-displacement curve. The load drop is a by-product of plastic localization, in my opinion, and you do not need a negative hardening curve to capture it.
Negative slope in hardening curves is typically not allowed since it's a source of numerical stability in simulation but perhaps someone in this forum can help with its implementation via APDL commands, if possible.
Thanks for checking the quarter model. If you don't see the multiple neck in the experiment (as opposed to the current model), there are some numerical tricks to help it initiate at the center, I should refer you to the same paper again, but it is better to finalize the hardening curve first before proceeding with this.
-
November 10, 2023 at 2:36 pm
henrique.geraissate
Subscriberhi Armin,
Thank you again!
Would you mind explaining how can I use these two material models? I mean, looking at them in the APDL manual and in the Engineering Source GUI, I have no idea how I could define the needed parameters. Should I use an external fitting algorithm with the function described in the manual to define the missing parameters? Or does Workbench can do it on its own? I am asking because, at least in Workbench, I can't see a way to input my data, but rather only the fields for the Initial yield stress and the exponent N.
Yes, in the experiment from which I retrieved the stress-strain data there were no multiple necking in any of the 10 samples I tested. I will read through the paper to have some insights.
Cheers!
-
November 10, 2023 at 4:13 pm
Armin
Ansys EmployeeHi Henrique,
No problem. As far as I know, curve fitting with these options is currently not available in Mechanical GUI, but if you look up the format of power-law or Voce equations, they have simple forms and curve fitting can be done in Excel or using other codes. You may look that up online to find some good information.
-
November 16, 2023 at 2:15 pm
henrique.geraissate
SubscriberHello Armin,
Unfortunately I will have to put this project in standby for a while, but at least I have now a nice reference to read through.
I do have a couple of last questions I would like to ask though: despite this multiple necking issue that I see in my simulation, it should be OK to use that exact material model for analysis up to the necking stress/strain, right? Or does this also mean that my data is somehow "wrong"?
Also, from what you said about fitting with power-law or Voce function, I understood that I should only use data from the Yielding point to the necking, without any negative slope, just like the MISO model. Is that correct?
Thank you again for all the help and explanations, I really appreciate that!
-
November 16, 2023 at 7:13 pm
Armin
Ansys EmployeeHi Henrique,
No worries, I'm glad to help. Please keep us posted on how the project goes once you re-visited it. Here are my responses to your questions:
Q1: Given that the material experiences a uniaxial loading until necking (the stress state deviates from uniaxial tension after necking), your analysis should be valid until necking provided that the general setup like BCs, etc. have been implemented correctly.
Q2: That's right. You should only use the experimental data from yield point until necking and let the fitted function predict stresses at larger strains. You may then use the resulting curve in the simulation to see how closely you can reproduce the post-necking regime, and if necessary, adjust the curve accordingly. This approach is sometimes called an “inverse-analysis” to extract the stress-strain response.
-
- The topic ‘Simulation of a Tensile Test to validate material properties’ is closed to new replies.


-
4833
-
1587
-
1386
-
1242
-
1021

© 2026 Copyright ANSYS, Inc. All rights reserved.


