TAGGED: cfd, fluent, sliding-mesh, turbine, turbine-rotation, wind-turbine, wind-turbine-cfd
-
-
October 9, 2024 at 7:22 am
oe23s006
SubscriberHi everyone,
I am currently working on Savonius hydro turbine in 2D. During my validation I noticed that up to the stall point, the trend is following, but after the stall point the Cp is still increasing. I have tried different methods like changing the scheme, turbulence model, gradients and validation paper also. Still I persist the same issue.
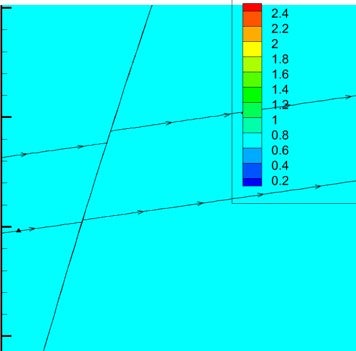
My wall y+ is also <1. It can be seen from the images that at TSR 0.6 where it is matching with experiment, my streamlines are connecting outside and inside the MRF, while at after stall point it is not.
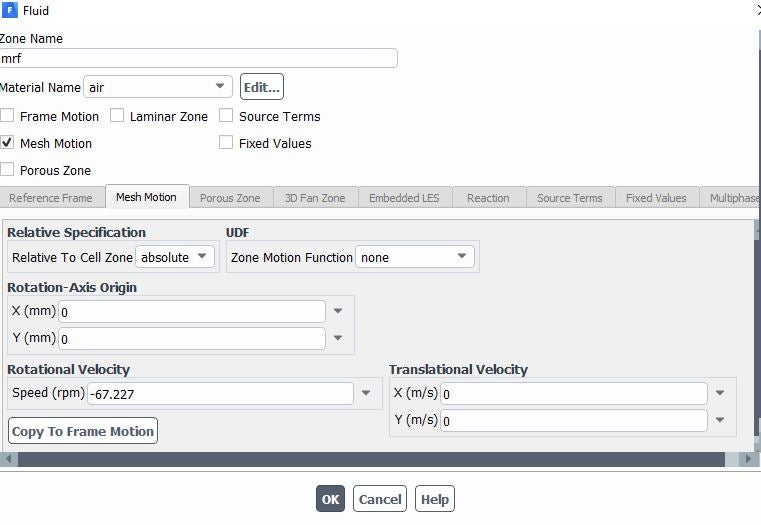
(ignore fluid air, I manually input the values of water and did not change the name). My my mesh count is closer to 0.37 million which can be seen in literature also for 2D case. The boundary conditions are symmetry sides and pressure outlet with blades as wall. (negative omega as it is rotating in Clockwise direction).
Can someone please help me, I am stuck in this for te past 3 months.
-
October 9, 2024 at 9:29 am
Rob
Forum ModeratorPlease can you post an image of the velocity contour?
-
October 9, 2024 at 10:30 am
-
October 9, 2024 at 12:50 pm
Rob
Forum ModeratorIs the mesh sliding or reference frame? The two images look very similar, and some of the variation is explainable by a shorter flow residence time: ie the initial solution hasn't been fully flushed out of the domain.
-
October 9, 2024 at 1:26 pm
oe23s006
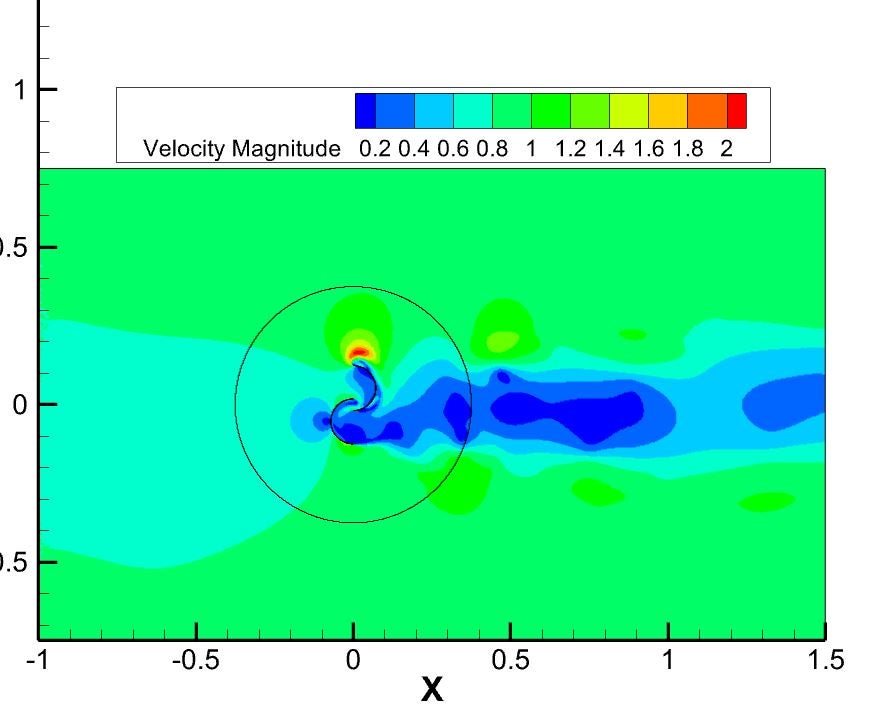
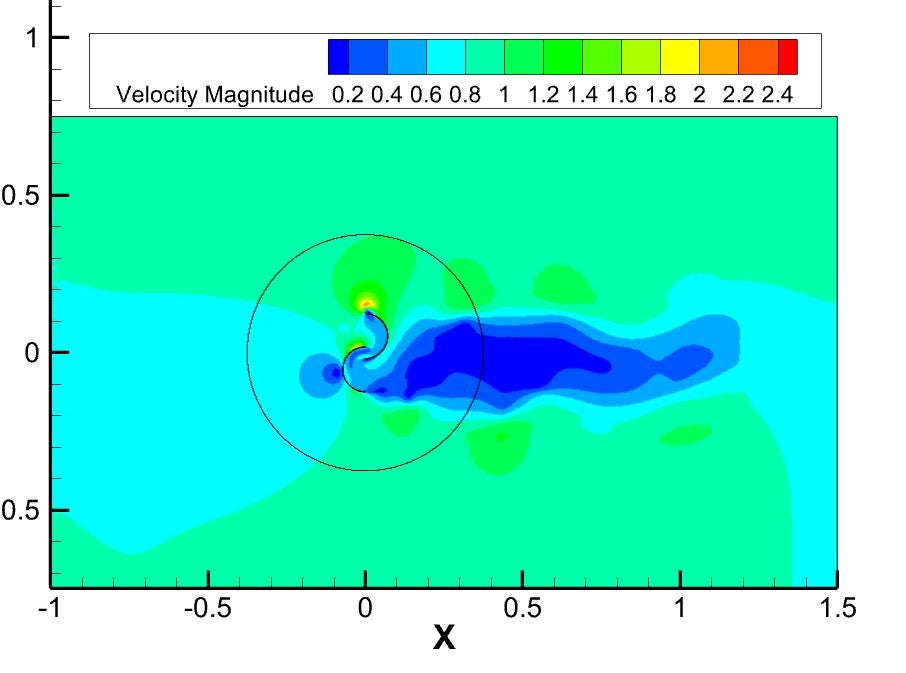
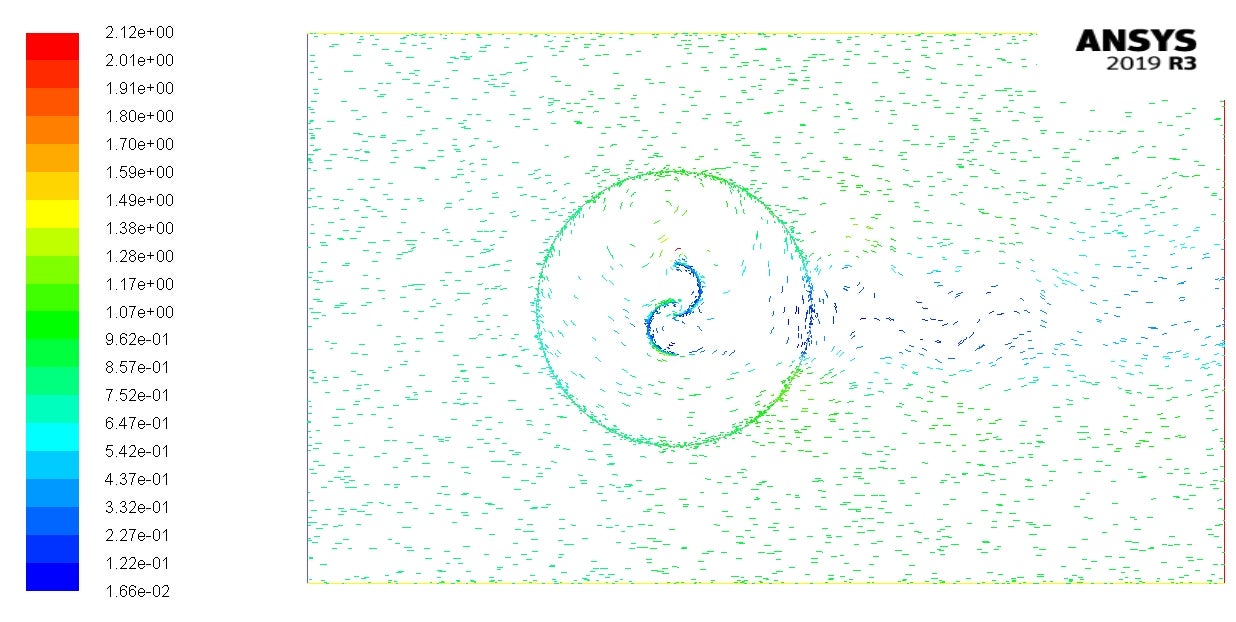
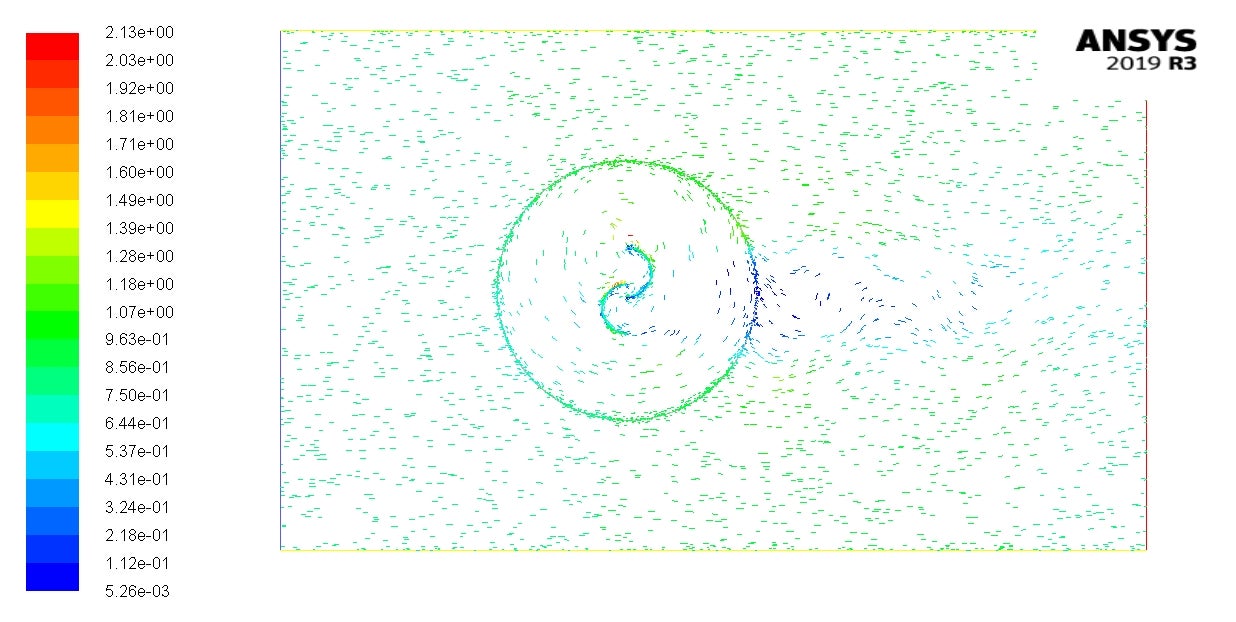
SubscriberThis is the transient simulation I have done sir. Since my turbine rotates the clockwise rotation I put negative in omega. The first contour is for tsr=0.6 (closer to experiment) which has maximum of 2 m/s velocity and second is for tsr=1.1 (deviating from experiment) which has maximum velocity of 2.4 m/s. I have put images of both tsr for your reference sir.
I have used k-epsilon realizable with enhanced wall treatement model.
I did not understand the of initial solution being fully flushed out of the domain sir.
The image shown is for MRF at tsr=1.1 (ignore air, as I manually entered water properties and saved changes in the same name)
-
October 9, 2024 at 1:58 pm
Rob
Forum ModeratorOK, not mrf, that's Frame Motion. You're using sliding mesh (Mesh Motion) which is very different.
Look at the right hand end of the lower image. The odd tail to the wake may be due to overall domain residence time meaning you still have some influence of the initial condition. That may also alter the pressure coefficient.
-
October 9, 2024 at 2:49 pm
oe23s006
SubscriberThe left image is pressure contour for tsr=0.6 (corr. to top velocity contour) and right is for tsr=1.1 (corr. to bottom velocity contour which you mentioned)
I am calculating the torque/moment sir in my case for finding the Cp.
But I see sir, so my domain is my problem. You are saying that it is causing the back pressure and interferring with the current iterations. Hence, I need to take a bigger domain?
-
October 9, 2024 at 2:54 pm
Rob
Forum ModeratorNot necessarily a bigger domain. But if you plot the cp (or whatever) over several cycles has the periodic profile stabilised?
-
October 9, 2024 at 2:58 pm
-
October 9, 2024 at 3:10 pm
Rob
Forum ModeratorYes, so the results should be OK. So, how does the pressure (not cp) report look over one cycle? Remember the cp is also using a reference value that may need to be checked.
-
October 9, 2024 at 3:31 pm
oe23s006
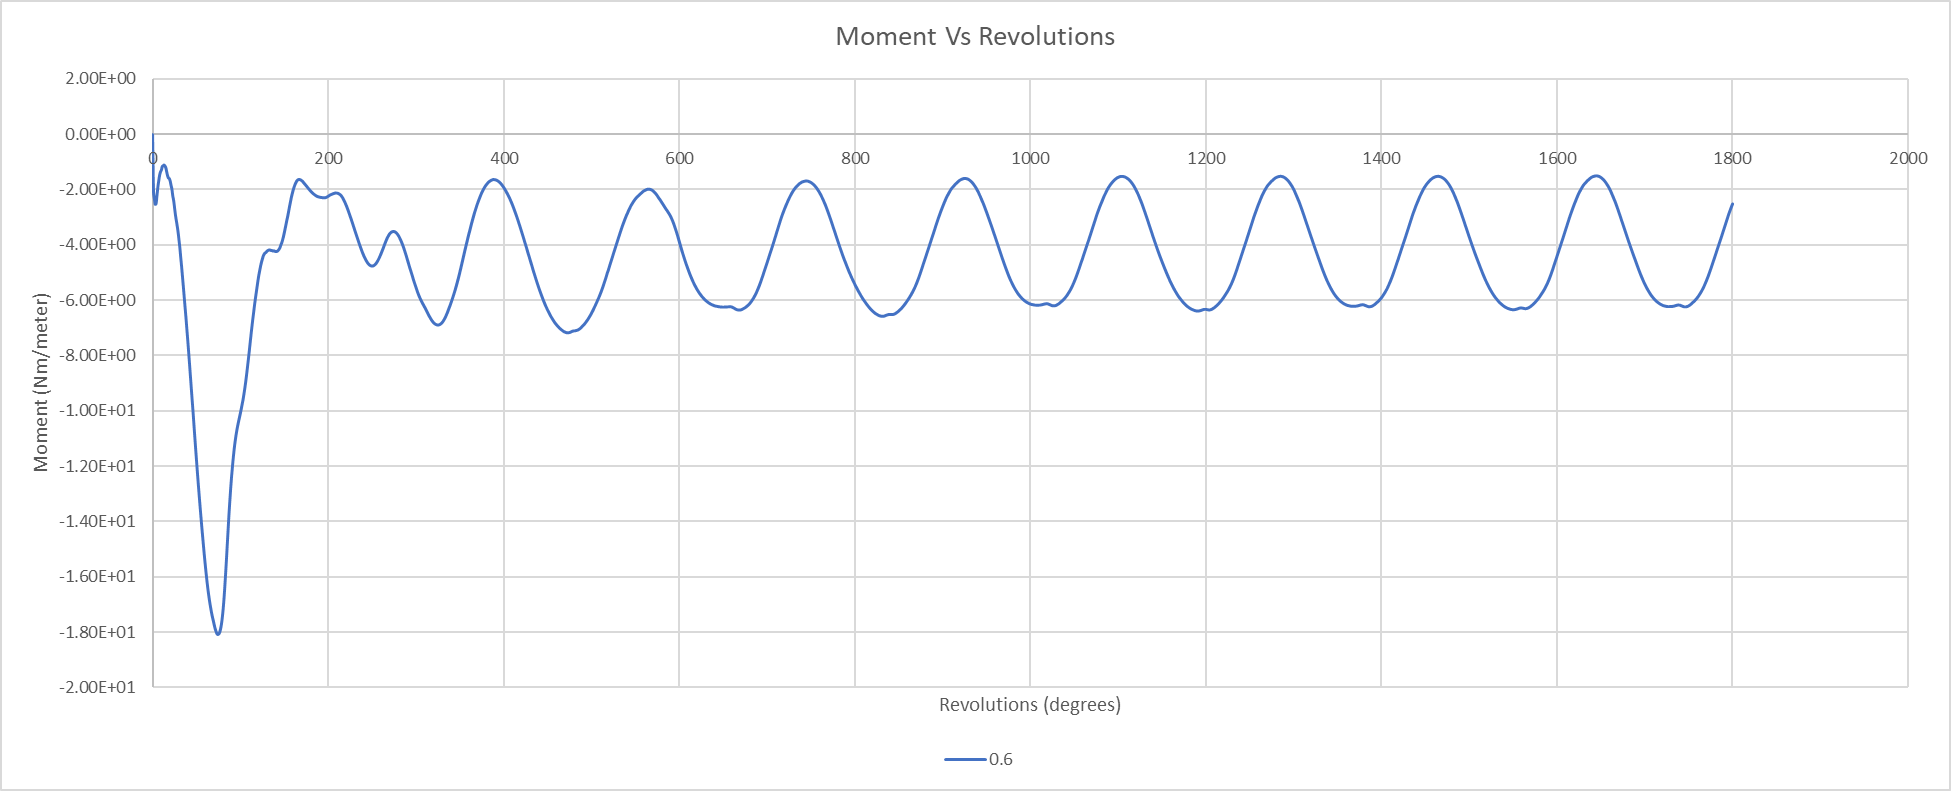
SubscriberTSR T at 5th rev 0.6 4.2053 0.7 3.9721 0.8 3.53 0.9 3.227 1 2.955 4th 1.1 2.771 4th 1.2 2.576 Sir I am calculating the average torque over one cycle. According to what you said, the graph should be coming according to experiment. So what could be the reason for the deviation after stall point (tsr=0.8). That is what I am not understanding
-
October 9, 2024 at 3:38 pm
Rob
Forum ModeratorNot sure - hence checking the reference values are still valid. Are you taking the numerical data directly from Fluent?
-
October 9, 2024 at 3:41 pm
oe23s006
SubscriberI am taking the txt file from “Report plots” from fluent and plotting in exel.
Sir I am using HPC cluster in my institute. Could there be any errors from that ?
-
October 9, 2024 at 4:14 pm
Rob
Forum ModeratorCore counts etc shouldn't change anything. The mesh looks OK, so it's likely down to convergence and set up or data interpretation.
-
October 10, 2024 at 5:53 am
oe23s006
SubscriberUnder relaxation factors Pressure Density Body forces Momentum TKE Turbulent dissipation rate Turbulent viscosity 0.2 1 1 0.4 0.6 0.6 1 Sir I canged the underrelaxation factors in fluent from the default according to my senior’s advice (the above table is the changed values from default). Is that the problem sir? what you mentioned about the initial value retaining?
-
October 10, 2024 at 10:56 am
Rob
Forum ModeratorThose should be fine. The initial value is simply that if you don't run a transient model long enough you can retain regions of flow that are the initial condition and are yet to be influenced by the calculated flowfield.
-
October 10, 2024 at 11:05 am
oe23s006
SubscriberI see.
Sir, I have created automatic create interface. Should I manually give matching interface for turbine. Is that why the streamlines are not matching inside the rotating domain and stationary domian? (first thread figure 5). Why it is not matching?
If so I belive that my problem will be solved when answered the above, as other points matching with experiment is having continuous streamlines from inlet to outlet (thread 1 fig 1), and those deviating have their streamlines discontinuous when approaching and leaving the rotating interface (thread1 fig 5)
-
October 10, 2024 at 12:32 pm
Rob
Forum ModeratorWhat are you plotting the pathlines in?
-
October 10, 2024 at 12:52 pm
oe23s006
Subscribertecplot
-
October 10, 2024 at 1:25 pm
Rob
Forum ModeratorHow do the Fluent generated results look?
-
October 11, 2024 at 4:54 am
-
October 11, 2024 at 8:42 am
Rob
Forum ModeratorAnd contours & pathlines? I can only comment on what I can see on here - so can only guide you to a solution using publically available information.
-
October 11, 2024 at 10:25 am
oe23s006
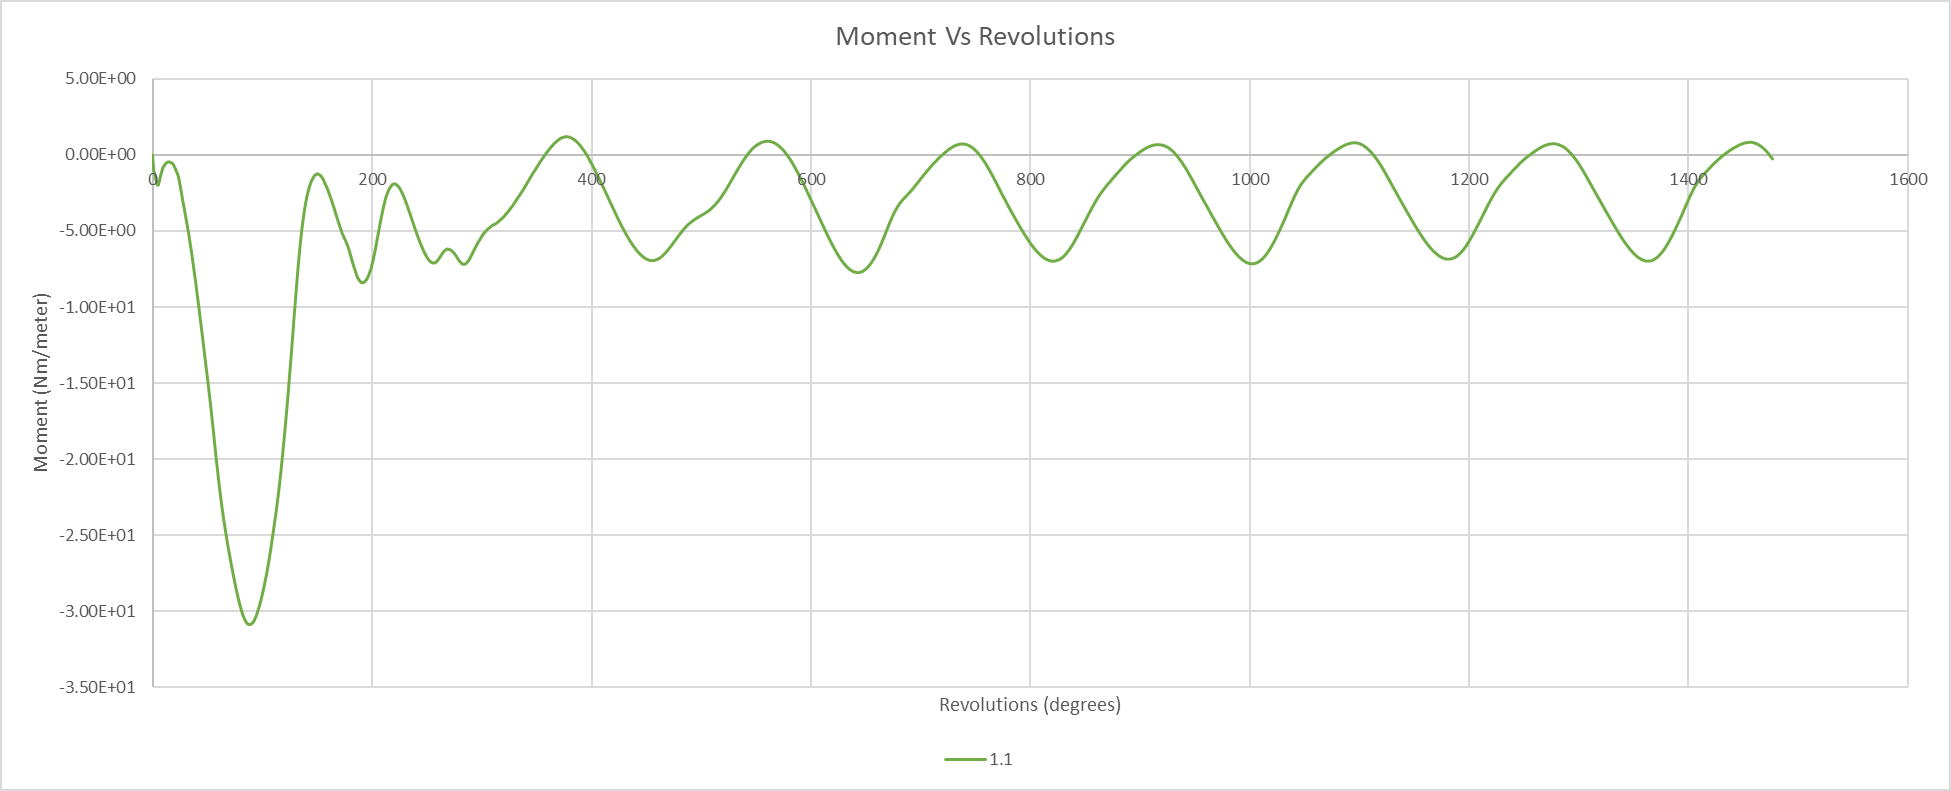
SubscriberSir, I have provided whatever graphs and plots (pressure, velocity, streamlines, validation graph) i have done. I don't know what else to give. The bottomline issue is that in my case, my torque is not dropping after stall point. It should drop.
Before stall, as omega is increased torque also should increase. But after stall omega is increased, torque should decrease to get proper graph (I sould get more back torque). But as seen from the torque graph (green), it should be more even in the other side of the zeroline to get this.
I think many people face this issue but I am not able to figure out why. I have changed models, validation paper, domain, schemes, gradient methods, mesh. I just can't get what I missed. Whatever I do I get the same issue.
Do I need to change the turbulence model constants or something?
-
October 11, 2024 at 12:14 pm
Rob
Forum ModeratorYou have shown a couple of graphs and some images for a single position. I have no idea if that's the stall or not. If you look at the flow at the just before stall, during and after what changes? How are you judging stall?
-
- You must be logged in to reply to this topic.


-
4783
-
1566
-
1386
-
1242
-
1021

© 2026 Copyright ANSYS, Inc. All rights reserved.


