-
-
October 29, 2024 at 11:33 am
jurgen.schmoll
SubscriberHello everyone,
I recently tried to tolerance a spectrograph, looking at the rms spot size as criterion. First I found that there is no "ignore lateral color" option, so the spot size in dispersion direction is something like 20mm which is the spectrum length. It would be really great to add the "ignore lateral color" as it is done in the merit function wizard.
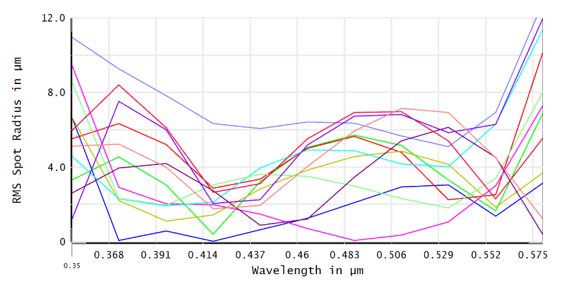
Nevertheless, I created a merit function with "ignore lateral color" to work around the problem. However, what I find now is that while my rms wavefront plot gives values between 8 micron and 12 micron:
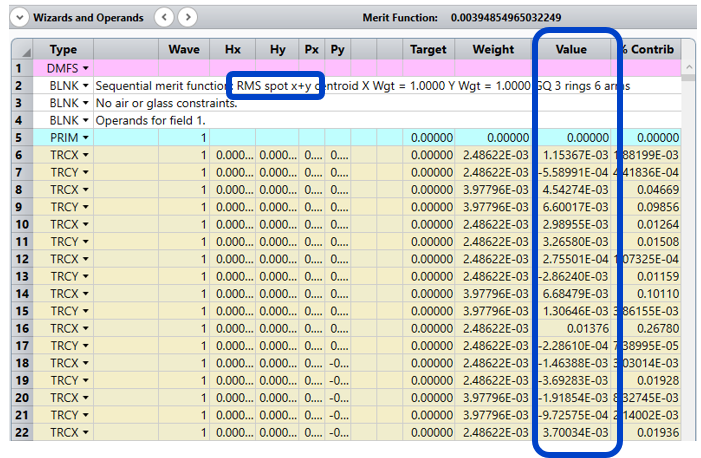
the merit function produces a value of 3.9 micron. Looking at the merit function, it says it adds the rms x and rms y values, but under "value" I get negative numbers. How can this be as rms values should always be positive? While I understand that radii are always positive, explaining the higher values in the plot above, I do not understand why the values in the "value" column which are rms(x) + rms(y) are sometimes negative:

If "value" is just the coordinate in x/y for a given wave, field and pupil position, the negative values make sense. So in this case the rms happens somewhere else not visible in the tolerance editor, and the contribution is calculated by this. However, it is still not clear for me why I only get 3.9 microns where the plot indicates 8-12 microns.
Thanks in advance for any clarification,
Jurgen -
November 1, 2024 at 7:12 pm
Ethan Keeler
Ansys EmployeeHi Jurgen,
The reason that the values are somtimes negative is that they are not directly representing the RMS in X or in Y. Instead, they are measuring the transerse aberration in X (TRCX) or Y (TRCY). The ray deviation for this aberration measurement can be positive or negative depending on where the real ray lands on the Image plane.
This Default Merit Function has been set such that the overall Merit Function value, shown at the top of the window, represents the RMS spot (X+Y). This value will always be positive. When you run the optimization, the optimizer looks to move this overall value as close to zero as possible by correcting abberations with the variables you set in your system. In your case where you are simply looking at the values calculated, then you'll want to consider the overall value, and not the individual values of each TRCX/TRCY operand.
Ethan
-
November 11, 2024 at 6:01 pm
jurgen.schmoll
SubscriberHi Ethan,
thank you for your reply and apologies for my late reaction. I forgot to tick the "send an email when a reply is coming in"-box ...
So the values are the transversal aberrations from the the ideal (0/0) spot location, and so they can be either positive or negative. What happens with rms spot (x+y) ? I wonder why the plot shows 8-12 micron rms spot radius, while the merit function of "rms spot (x+y)" shows only 3.9 micron. Mathematically, x+y could be negative if y>x, and it makes no sense to me for all it explains the smaller values. Should the rms (spot radius) not be more suitalbe, with the radius being the square root of (x^2 +y^2) for each lateral aberration point? Maybe I just misunderstand the expression "rms spot(x+y)" here. -
November 11, 2024 at 8:56 pm
Ethan Keeler
Ansys EmployeeHi Jurgen,
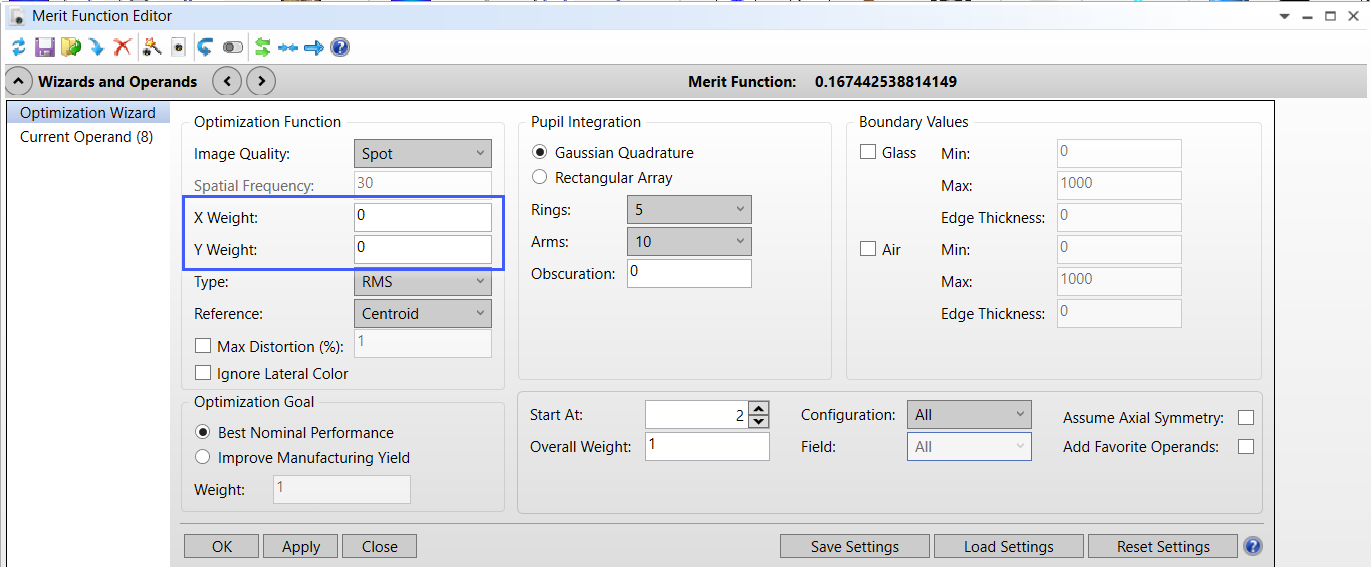
Just to clarify, the Merit Function as you've have set is giving you the extent of the transverse ray aberration for X and Y simultaneously, and in practive will typically represent the worst offender (larger aberration in X or in Y). In order to see a computation of the actual RMS spot radius, you should set the weight of X and Y to 0 in the Merit Function Wizzard:

You can find more information on what is being calculated here: Optimization Function Criteria.
Thanks,
Ethan -
November 11, 2024 at 10:51 pm
jurgen.schmoll
SubscriberDear Ethan,
I think you just served me the missing link! I just did what you recommended:
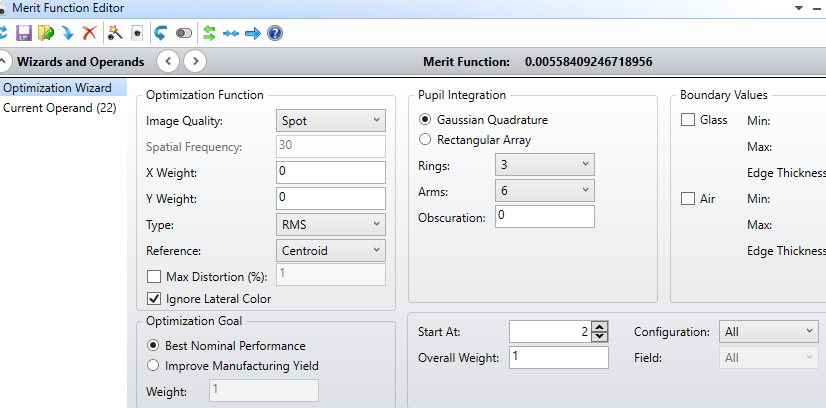
At first I got 19mm spot size, but "Ignore Lateral Color" sorted it! Of course, it is a spectrograph ...
I was not aware I needed to put the weights to zero to get a merit function which represents the RMS spot size. Now I got 5.6 micron instead of 3.9 micron which lies in the ballpark of the rms vs. wavelength plot of my first post. So I now understood what I was doing wrong!Thank you so much for pointing this out to me - this forum is a great learning experience!
-
- You must be logged in to reply to this topic.


-
4673
-
1565
-
1386
-
1231
-
1021

© 2025 Copyright ANSYS, Inc. All rights reserved.


