-
-
October 6, 2022 at 4:52 pm
AR
SubscriberHello,
Â
I perform a Response Spectrum in order to simulate an earthquake. But when I look at the acceleration results, the maximum values of these are less than the seismic spectrum that I have entered.
1- Shouldn't the acceleration results be equal to or greater than the accelerations entered in the spectrum?
2- The acceleration results what do they show exactly? Is it the largest acceleration that has occurred during the analysis or for what frequency does it show me this acceleration?Â
Below is possible to see the resonance frecuencies of the model and the spectrum for X axis (Y and Z axis are similar). The acceleration results should not be equal to or greater than the spectrum values?
Â
Â
Regards
-
October 7, 2022 at 12:10 pm
peteroznewman
SubscriberHello
Â
-
October 9, 2022 at 2:39 am
peteroznewman
SubscriberResults in a Response Spectrum analysis are the peak response over the entire event. Though this analysis uses Modal results, the output is not by frequency, it is the peak response due to all frequencies in the input spectrum. This is different than a Harmonic Response analysis which has output by frequency. Hopefully this answers question 2. Why must the response be greater than the input spectrum? For example, say you have an input spectrum that peaks at 3 Hz and drops to zero after 30 Hz, but you have a structure whose first mode is at 300 Hz. In that example, the output response is going to be practically zero. -
October 10, 2022 at 7:01 am
AR
Subscriber1.073 / 5.000ÂResultados de traducción
ÂÂThanks for your reply Peter.ÂI thought that the Response Spectrum analysis did something similar to the vibration tables used in seismic tests, that is, move the base with a specific acceleration for each frequency. So, in this case, although what is being analyzed does not have frequency modes in that frequency range, it has suffered the input acceleration, only its result has not increased because it does not have vibration modes that coincide with those frequency ranges.ÂSo, what Ansys does for the response spectrum analysis is to choose from the entered spectrum only the acceleration values ​​that correspond to a vibration mode and perform the calculations with those values? Imagine that I have a model with four resonance frequencies of 3, 10, 22, and 200 Hz, and a spectrum that has acceleration values ​​for those frequencies of 12, 4, 2, and 0 m/s^2, respectively. Ansys only does the calculations with the first three frequencies and ignores the others, those that are outside the acceleration range?ÂRegards -
October 10, 2022 at 10:45 am
peteroznewman
SubscriberYes, you have the right idea.Â
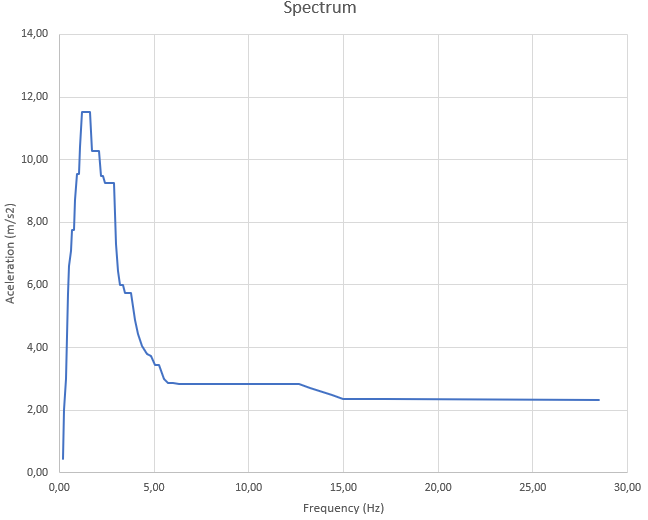
The time history of the earthquake can be run into the base of a SDOF mass-spring-damper oscillator with a specific natural frequency and the peak response S is recorded. That is repeated for a large number of SDOF oscillators of different natural frequencies to create the table. Note that damping has been included in the generation of the spectrum table already, so damping is not added in the Response Spectrum analysis as that would be double-counting. Only the spectrum table values that match one of the modal frequencies are used or the table is log-log interpolated to generate a spectrum value that matches each modal frequency. If the spectrum table doesn’t go as high in frequency as the modes, then the last value in the table is used. Note that the peak response put in the spectrum table could be displacement, velocity or acceleration.
Modal analysis provides a list of natural frequencies, mode shapes and participation factors. Recall that the modal participation factor (PFi) measures the amount of mass moving in a specific direction for a unit displacement and i goes from 1 to n for the number of modes. The Mode Coefficient (Ai) depends on whether the input spectrum table is displacement, velocity or acceleration. The Mode Coefficient is defined as the amplification factor that is multiplied by the eigenvector to give the actual displacement in each mode. If you had a spectrum table of peak displacements, then the Mode Coefficient is simply the Spectrum value times the Participation Factor. Ai = Si*PFi
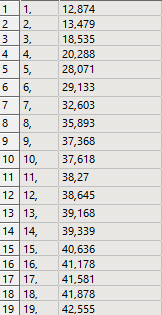
Since you have a spectrum table of peak acceleration, you have to divide by the frequency (w) squared. Ai = Si*PFi/w^2
Since you have modes that go higher than your spectrum table, all higher modes will be multiplied by the last value in the table.
The modal displacement response is {Ri} = Ai{EVi} where EV is the Eigenvector for the ith mode.
The modal acceleration response is {Ri} = Ai/wi^2{EVi} where wi is the Natural Frequency of the ith mode.
Lastly, the modes must be combined to get the total response. The default method is Square Root of the Sum of the Squares (SRSS) Method.
So to answer your original first question, the acceleration response is calculated from the acceleration spectrum value times the participation factor then combine all modes in a SRSS calculation. So in your imagined case with four modes, you must also say what the participation factor is to complete the calculation.
-
October 11, 2022 at 7:45 am
AR
SubscriberOk,
Thank you very much for your answer : )Â
Best regards
-
- The topic ‘Results of Response Spectrum’ is closed to new replies.
- The legend values are not changing.
- LPBF Simulation of dissimilar materials in ANSYS mechanical (Thermal Transient)
- APDL, memory, solid
- Convergence error in modal analysis
- How to model a bimodular material in Mechanical
- Meaning of the error
- Simulate a fan on the end of shaft
- Real Life Example of a non-symmetric eigenvalue problem
- Nonlinear load cases combinations
- How can the results of Pressures and Motions for all elements be obtained?
-
3862
-
1414
-
1220
-
1118
-
1015
© 2025 Copyright ANSYS, Inc. All rights reserved.