-
-
July 5, 2021 at 4:23 pm
Autonewbie
SubscriberHi, after reading some notes... I still not able to determine when to use response spectrum or random vib. Anyone can share your tips? Thanks!
July 5, 2021 at 5:35 pmpeteroznewman
SubscriberLook at the input data you have to excite the structure.
If the input is a table of values of acceleration PSD values in the units of G^2/Hz vs frequency in Hz, that is the type of input you use in a Random Vibration analysis. The output of the Random Vibration analysis is the 1-sigma value of stress, which means the response will be less than that value 68% of the time. You can multiply that value of stress by a factor of 2 to get a 2-sigma value and the response will be less than that value 95.45% of the time. You can multiply that value of stress by a factor of 3 to get a 3-sigma value and the response will be less than that value 99.73% of the time.
If the input is a table of values of acceleration in units of G vs frequency in Hz, that is the type of input you use in a Response Spectrum analysis. The output of the Response Spectrum analysis is the predicted maximum response the structure will have to that input.
The above examples mention acceleration, but tables using velocity or displacement are also possible, though less common.
Both Random Vibe and Response Spectrum have in common a requirement for a Modal Analysis with a Fixed Support to create the Base Excitation where the input goes in.
If you have acceleration-time data, and not a short table of values vs frequency, you can compute either a PSD table or a Shock Response Spectrum table to use as input.
If the acceleration-time data is a sample from a vibration source that may run for a long time, like an engine, and each time you record a sample of the vibration using an accelerometer, the statistical values of the recording are the same, then you would want to analyze a structure subject to that vibration using Random Vibration.
If the acceleration-time data is the complete record of an event, such as an earthquake, and you want to know if the structure will survive that particular event, then you want to analyze the structure using Response Spectrum.
Read the help to learn more. Open ANSYS Help from the Start menu, then copy paste the URL below into the address bar.
https://ansyshelp.ansys.com/account/secured?returnurl=/Views/Secured/corp/v211/en/wb_sim/ds_response_spectrum_analysis_type.html
https://ansyshelp.ansys.com/account/secured?returnurl=/Views/Secured/corp/v211/en/wb_sim/ds_spectral_analysis_type.html
If you have acceleration-time data, you could use that data directly as input to a Transient Structural analysis, but for even small models, the computational time to run a 30 second earthquake can be long and it is much faster to convert the acceleration-time data into a Shock Response Spectrum and run the Response Spectrum analysis.
If instead of an event like an earthquake, which has a specific maximum acceleration, you record acceleration data from a running engine, generating random vibrations. Because of the statistical nature of the vibration, the longer you record, the larger the maximum acceleration will be. You can predict the probability of exceeding a specific value by doing statistics on a relatively short recording, even if that value was not recorded.
When I have acceleration-time data, I use a matlab script called vibrationdata to create a PSD table or a Shock Response Spectrum table for input into ANSYS.
July 26, 2023 at 11:13 amArjuna Nagaraju
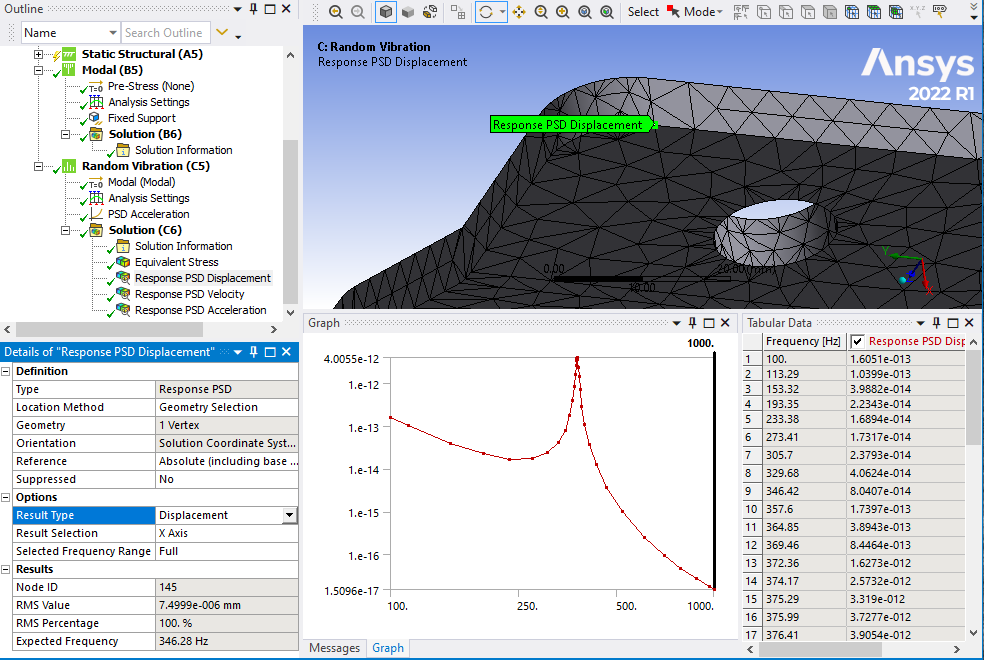
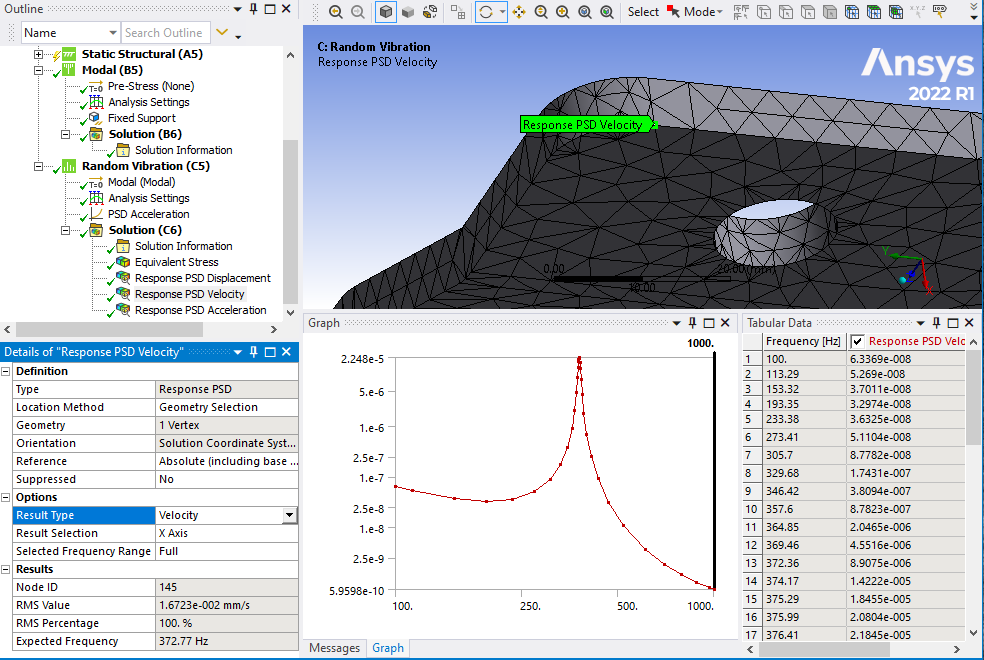
Subscriber@peteroznewman, I have the Acceleration((mm/s2)2/Hz) based PSD spectrum as input and for this input there will be Acceleration PSD-Response output with same units as (mm/s2)2/Hz and Dsiplacement PSD-Response as (mm)2/Hz. Can we convert (mm/s2)2/Hz to mm/s2 and (mm)2/Hz to mm? Is this converstion possible. The goal is: I want to know the Acceleration and Displacement Peak values for all the frequencies. Thank you!
July 30, 2023 at 11:33 amJuly 31, 2023 at 12:53 pmArjuna Nagaraju
Subscriber@peteroznewman, thank you for your feedback.
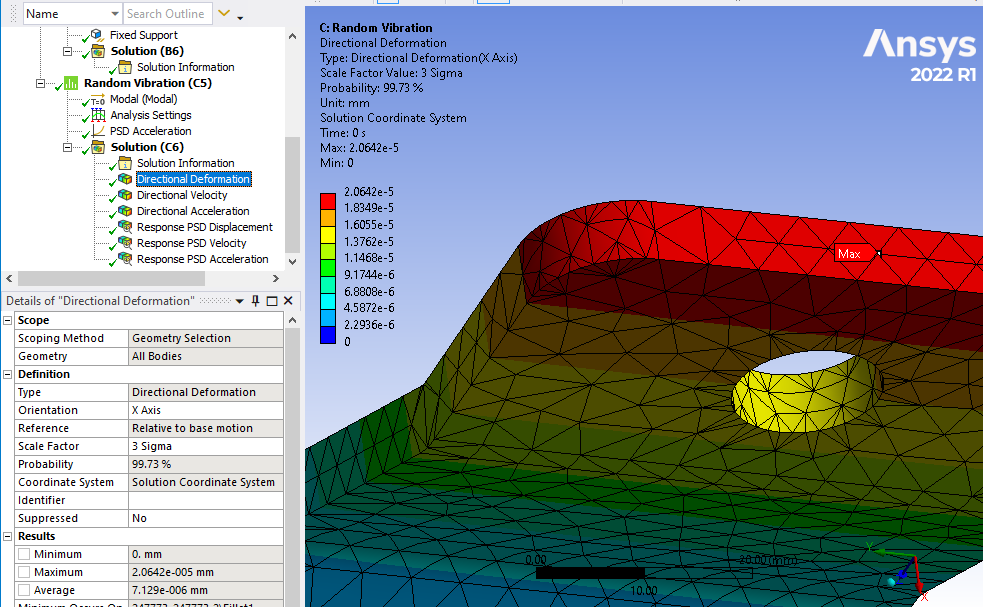
You are right and I am already aware of available outputs to plot the Response-PSD as Displacement or Acceleration.However, I am interested in Acceleration(mm/s2) plot in random vibration and not the Acceleration-Response-PSD((mm/s2)2/Hz). Further, the Displacement(mm) plot and not the Displacement-Response-PSD.
I want the Acceleration(mm/s2) and Displacement(mm) plots to compare my real test plots which are extracted from shaker using sensors.
July 31, 2023 at 6:10 pmpeteroznewman
SubscriberOh, I see I did not clearly read your question.
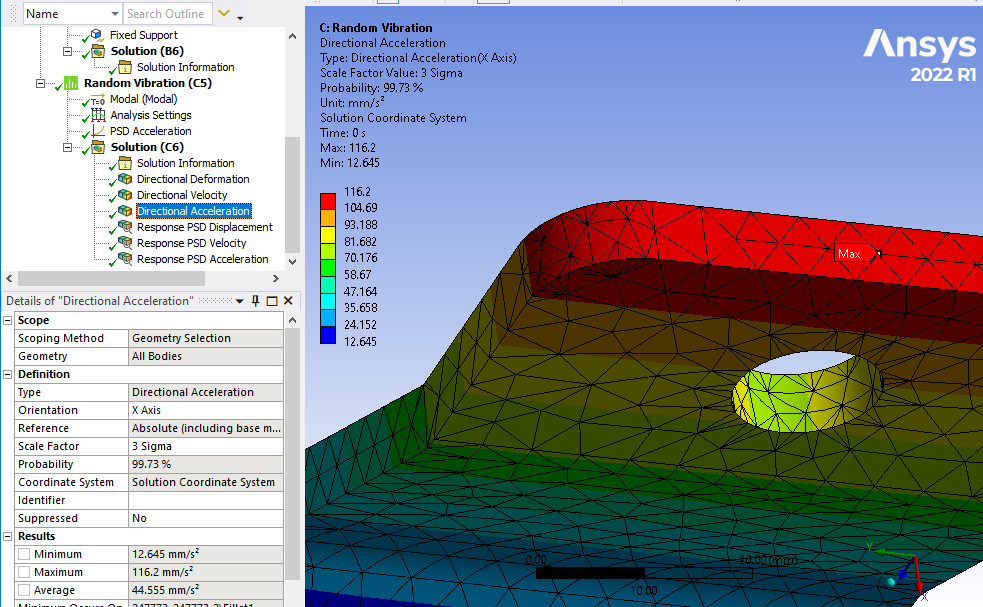
To answer the question you asked, the output of Displacement, Velocity and Acceleration is a statistical quantity, therefore you can request output at the 1 sigma, 2 sigma or 3 sigma statistical values of standard deviation (or a custom value). I have chosen the 3 sigma values to plot.
You may have to change some Output Controls to write out the data to plot these.
August 1, 2023 at 8:19 amArjuna Nagaraju
SubscriberStill this output will give statistical values of standard deviation that occurs in the whole frequency range and not for the every eigen modes. For example in your Acceleration image, the maximum Acceleration value is 116.2 mm/s2 and we don't know for which frequency is this maximum value occuring. It can be for any frequency and occurs statically once.
However in your previous image, the Response-PSD-Acceleration is for all frequencies and it has peak at around ~380Hz. If I want to know the Acceleration value for the particular frequency ~380Hz, then it is not possible with the Acceleration Output(1 sigma, 2 sigma, 3 sigma). Therfore, I assume we can just see only statistical quantity with current options.
August 1, 2023 at 11:03 ampeteroznewman
SubscriberRandom vibration contains a spectrum of frequencies. Stationary random vibration has the same spectrum of frequencies over time. The spectrum of frequencies is characterized by the PSD table that is the input to the random vibration analysis. The output is a statistical result. If you are interested in the maximum value of acceleration rather than the 3 sigma value, that depends on how long the test runs. The longer the duration of the test, the higher will be maximum value of acceleration.
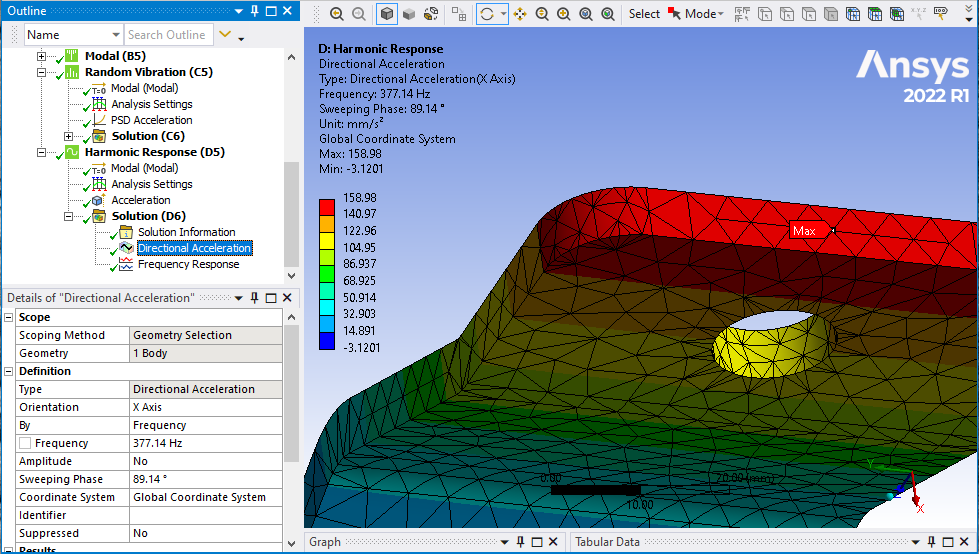
Harmonic Response analysis typically uses a fixed value of acceleration swept over a frequency range. At each frequency, the input is a pure sine wave at that frequency and amplitude. Therefore, the output response is not statistical, it is a single value at each node. In the plots below, the input acceleration was 2 mm/s^2.
August 1, 2023 at 11:06 amArjuna Nagaraju
SubscriberYa, got it, thank you!
Viewing 8 reply threads- The topic ‘Response Spectrum vs Random vibration’ is closed to new replies.
Innovation SpaceTrending discussionsTop Contributors-
4888
-
1587
-
1386
-
1242
-
1021
Top Rated Tags© 2026 Copyright ANSYS, Inc. All rights reserved.
Ansys does not support the usage of unauthorized Ansys software. Please visit www.ansys.com to obtain an official distribution.
-


Ansys Assistant

Welcome to Ansys Assistant!
An AI-based virtual assistant for active Ansys Academic Customers. Please login using your university issued email address.
Hey there, you are quite inquisitive! You have hit your hourly question limit. Please retry after '10' minutes. For questions, please reach out to ansyslearn@ansys.com.
RETRY
