

TAGGED: ansys-fluent, convergence, fuel-cell, residual, simulation
-
-
December 23, 2021 at 10:13 am
awesomestudent
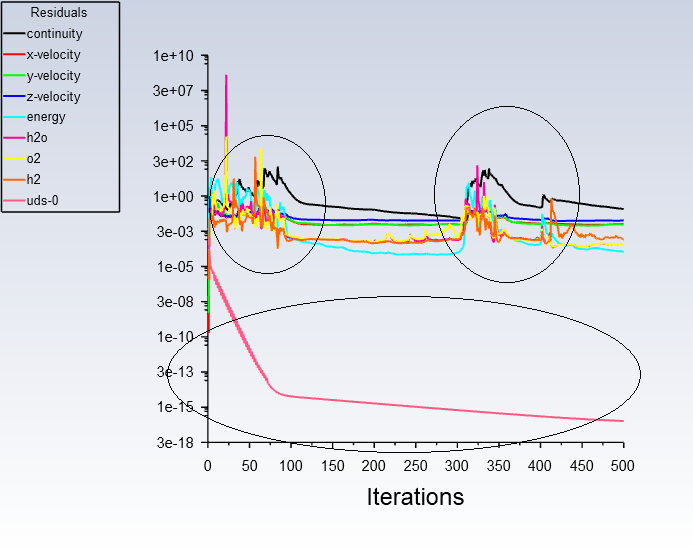
SubscriberHello, I recently performed a simulation of Fluid Flow (Fluent). In the end, the calculation was made, at this residual chart was created. But I have no idea the meaning of it. Is good the chart? What is that fluctuating line? what causes it? Why some lines are straight? How do I fix/improve this? Any help would be much needed.
December 23, 2021 at 11:41 amRob
Forum ModeratorThe residuals are a function of the error in the solution, and are one of the tools we use to judge if the solution is accurate. Have a look in the tutorials (click on Help) and other materials (click on Courses at the top of the page) for more information.
The plot you have suggests the solver is still trying to find a single converged state so may need to be run on for more iterations. However, you also need to check the mesh (cell quality and resolution) and set up to ensure it's suitable.
December 23, 2021 at 11:59 amSubscriberI see, my cell quality is quite good. It has skewness below 0.98 and the resolution I used is 2. All are at high and fine meshing. I try performing on a higher number of iteration. Basically what I understand here is that the meshing greatly influence the residual chart.
December 23, 2021 at 1:15 pmForum ModeratorA skew below 0.98 isn't good, below about 0.8 is good, under 0.95 is probably acceptable. Resolution of 2 just means you set a cell size: how does that compare to the geometry and flow field?
December 23, 2021 at 1:37 pmSubscriber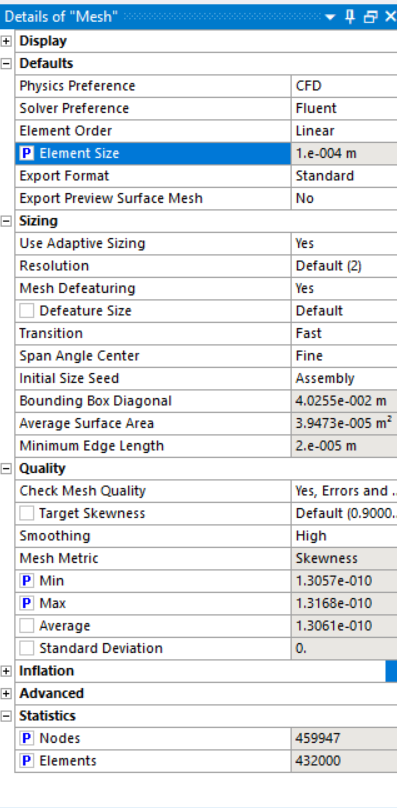 This is the result of meshing
December 23, 2021 at 2:54 pmForum ModeratorThat just tells me the cells are all good. Plot a few contours of velocity & pressure with the node values off and post those.
December 23, 2021 at 3:07 pmSubscriberhow do I do that? Do you have a link as guide?
December 23, 2021 at 3:16 pmForum ModeratorClick on "Help" in Fluent and do the first few tutorials. All (should) become clear.
January 5, 2022 at 7:54 amSubscriberI still don't know how and which HELP button to click
January 5, 2022 at 11:50 amForum ModeratorAny of them in Fluent - they all link to the documentation.
Viewing 9 reply threads- The topic ‘Residual Chart and its meaning?’ is closed to new replies.
Innovation Space Trending discussions
 Top Contributors
-
peteroznewman
 5159
5159 -
scabo
 1836
1836 -
Dennis Chen
 1387
1387 -
javat33489
 1249
1249 -
Shyam Prasad V Atri
1021
Top Rated Tags
© 2026 Copyright ANSYS, Inc. All rights reserved.
Ansys does not support the usage of unauthorized Ansys software. Please visit www.ansys.com to obtain an official distribution.
-


The Ansys Learning Forum is a public forum. You are prohibited from providing (i) information that is confidential to You, your employer, or any third party, (ii) Personal Data or individually identifiable health information, (iii) any information that is U.S. Government Classified, Controlled Unclassified Information, International Traffic in Arms Regulators (ITAR) or Export Administration Regulators (EAR) controlled or otherwise have been determined by the United States Government or by a foreign government to require protection against unauthorized disclosure for reasons of national security, or (iv) topics or information restricted by the People's Republic of China data protection and privacy laws.
