TAGGED: boundary-condition, fluent, temperature-profile
-
-
February 17, 2022 at 12:44 pm
vsjay3
SubscriberHi All,
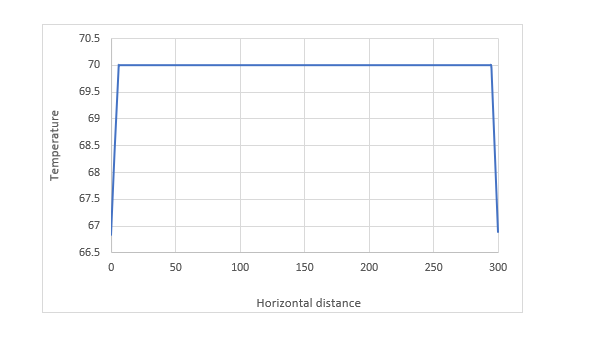
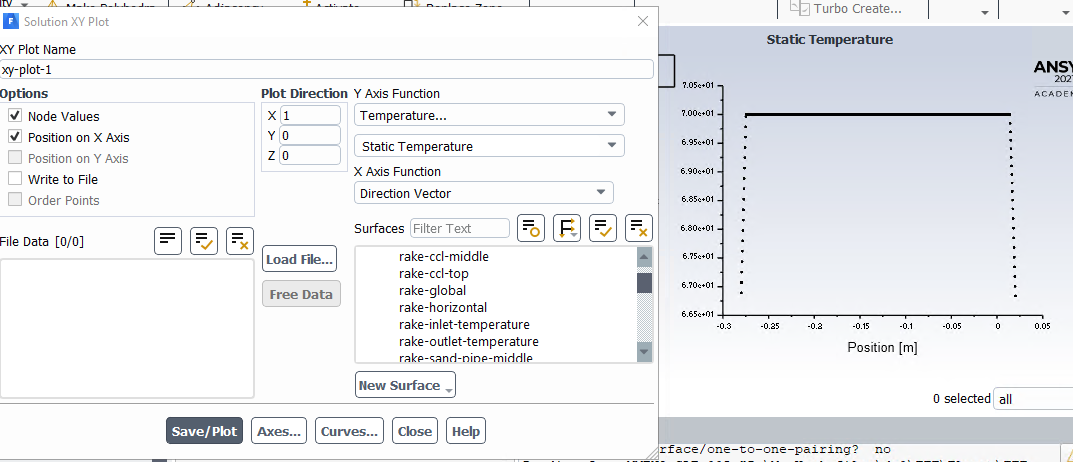
I am modelling the heating of a solid block using Ansys Fluent. The top surface of the solid block has a fixed temperature of 70C (as boundary condition). The four side walls of the solid are adiabatic (i.e., the 4 walls of the block are assigned zero heat fluxes). After modeling, when I plot the temperature of the top surface along the horizontal distance of the block, near the corners (or side walls) it shows that the 70C drops a bit. I do not know why? I expected the 70C temperature to be constant along the entire horizontal distance of the solid block since the temperature assigned to the top surface of the block was fixed in the boundary condition.
Any explanation would be highly appreciated!
February 17, 2022 at 1:08 pmRob
Forum ModeratorDid you have node values on or off?
February 17, 2022 at 1:40 pmFebruary 17, 2022 at 1:55 pmRob
Forum ModeratorTurn off node values, and similarly on the contour plot. If you put a plane through the domain how does the temperature look?
February 17, 2022 at 2:13 pmvsjay3
Subscriber
With node values on:
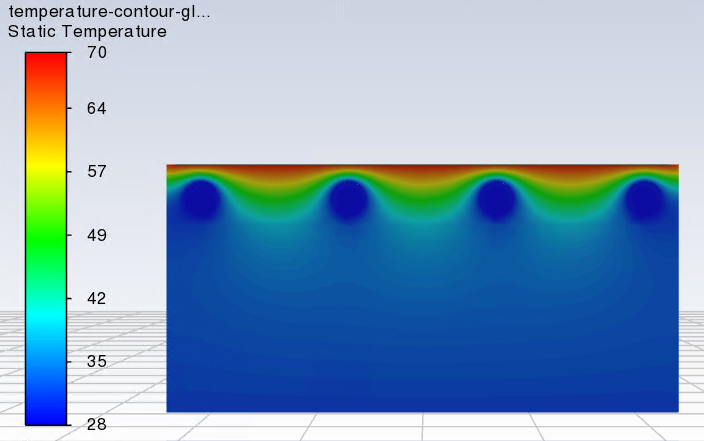
With node values off:
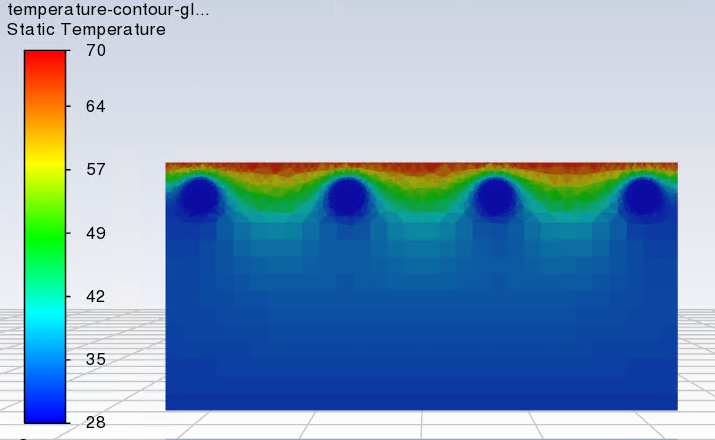 with node values off:
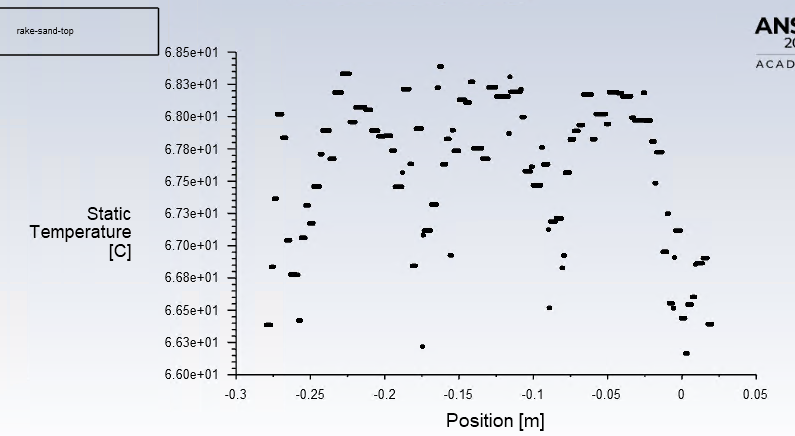
Although I have to say - there are a few cooling pipes (cool water flowing inside) embedded in the solid a small distance beneath the top surface. Do you think they are the culprit?
But then, the bottom surface of the solid block also has a fixed temperature of 31C, and while it is located a long distance from the cooling pipes, it also exhibits a similar pattern to the top surface (temperature differs near side walls). So maybe it is not the cooling pipe effect. Anyhow, if the temperature is fixed, it should be fixed throughout the surface don't you think (regardless of the presence of cooling pipes or not)?
February 17, 2022 at 3:01 pmRob
Forum ModeratorThe cooling pipes will have an effect. Remember you're setting the surface temperature(s) but solving the cell temperature. When you plot on the surface with node values on (ticked in the contours panel) some smoothing takes place so the cell temperature influences what is plotted.
February 19, 2022 at 4:48 amvsjay3
Subscriber
Thank you for your answer!
Viewing 6 reply threads- The topic ‘Re: Surface temperature’ is closed to new replies.
Innovation SpaceTrending discussionsTop Contributors-
5149
-
1831
-
1387
-
1248
-
1021
Top Rated Tags© 2026 Copyright ANSYS, Inc. All rights reserved.
Ansys does not support the usage of unauthorized Ansys software. Please visit www.ansys.com to obtain an official distribution.
-

