Fluids

Fluids

Topics related to Fluent, CFX, Turbogrid and more.

Radial averaging along complex pipe geometry

    • Max Ehrfeld
      Subscriber

      Hello together,

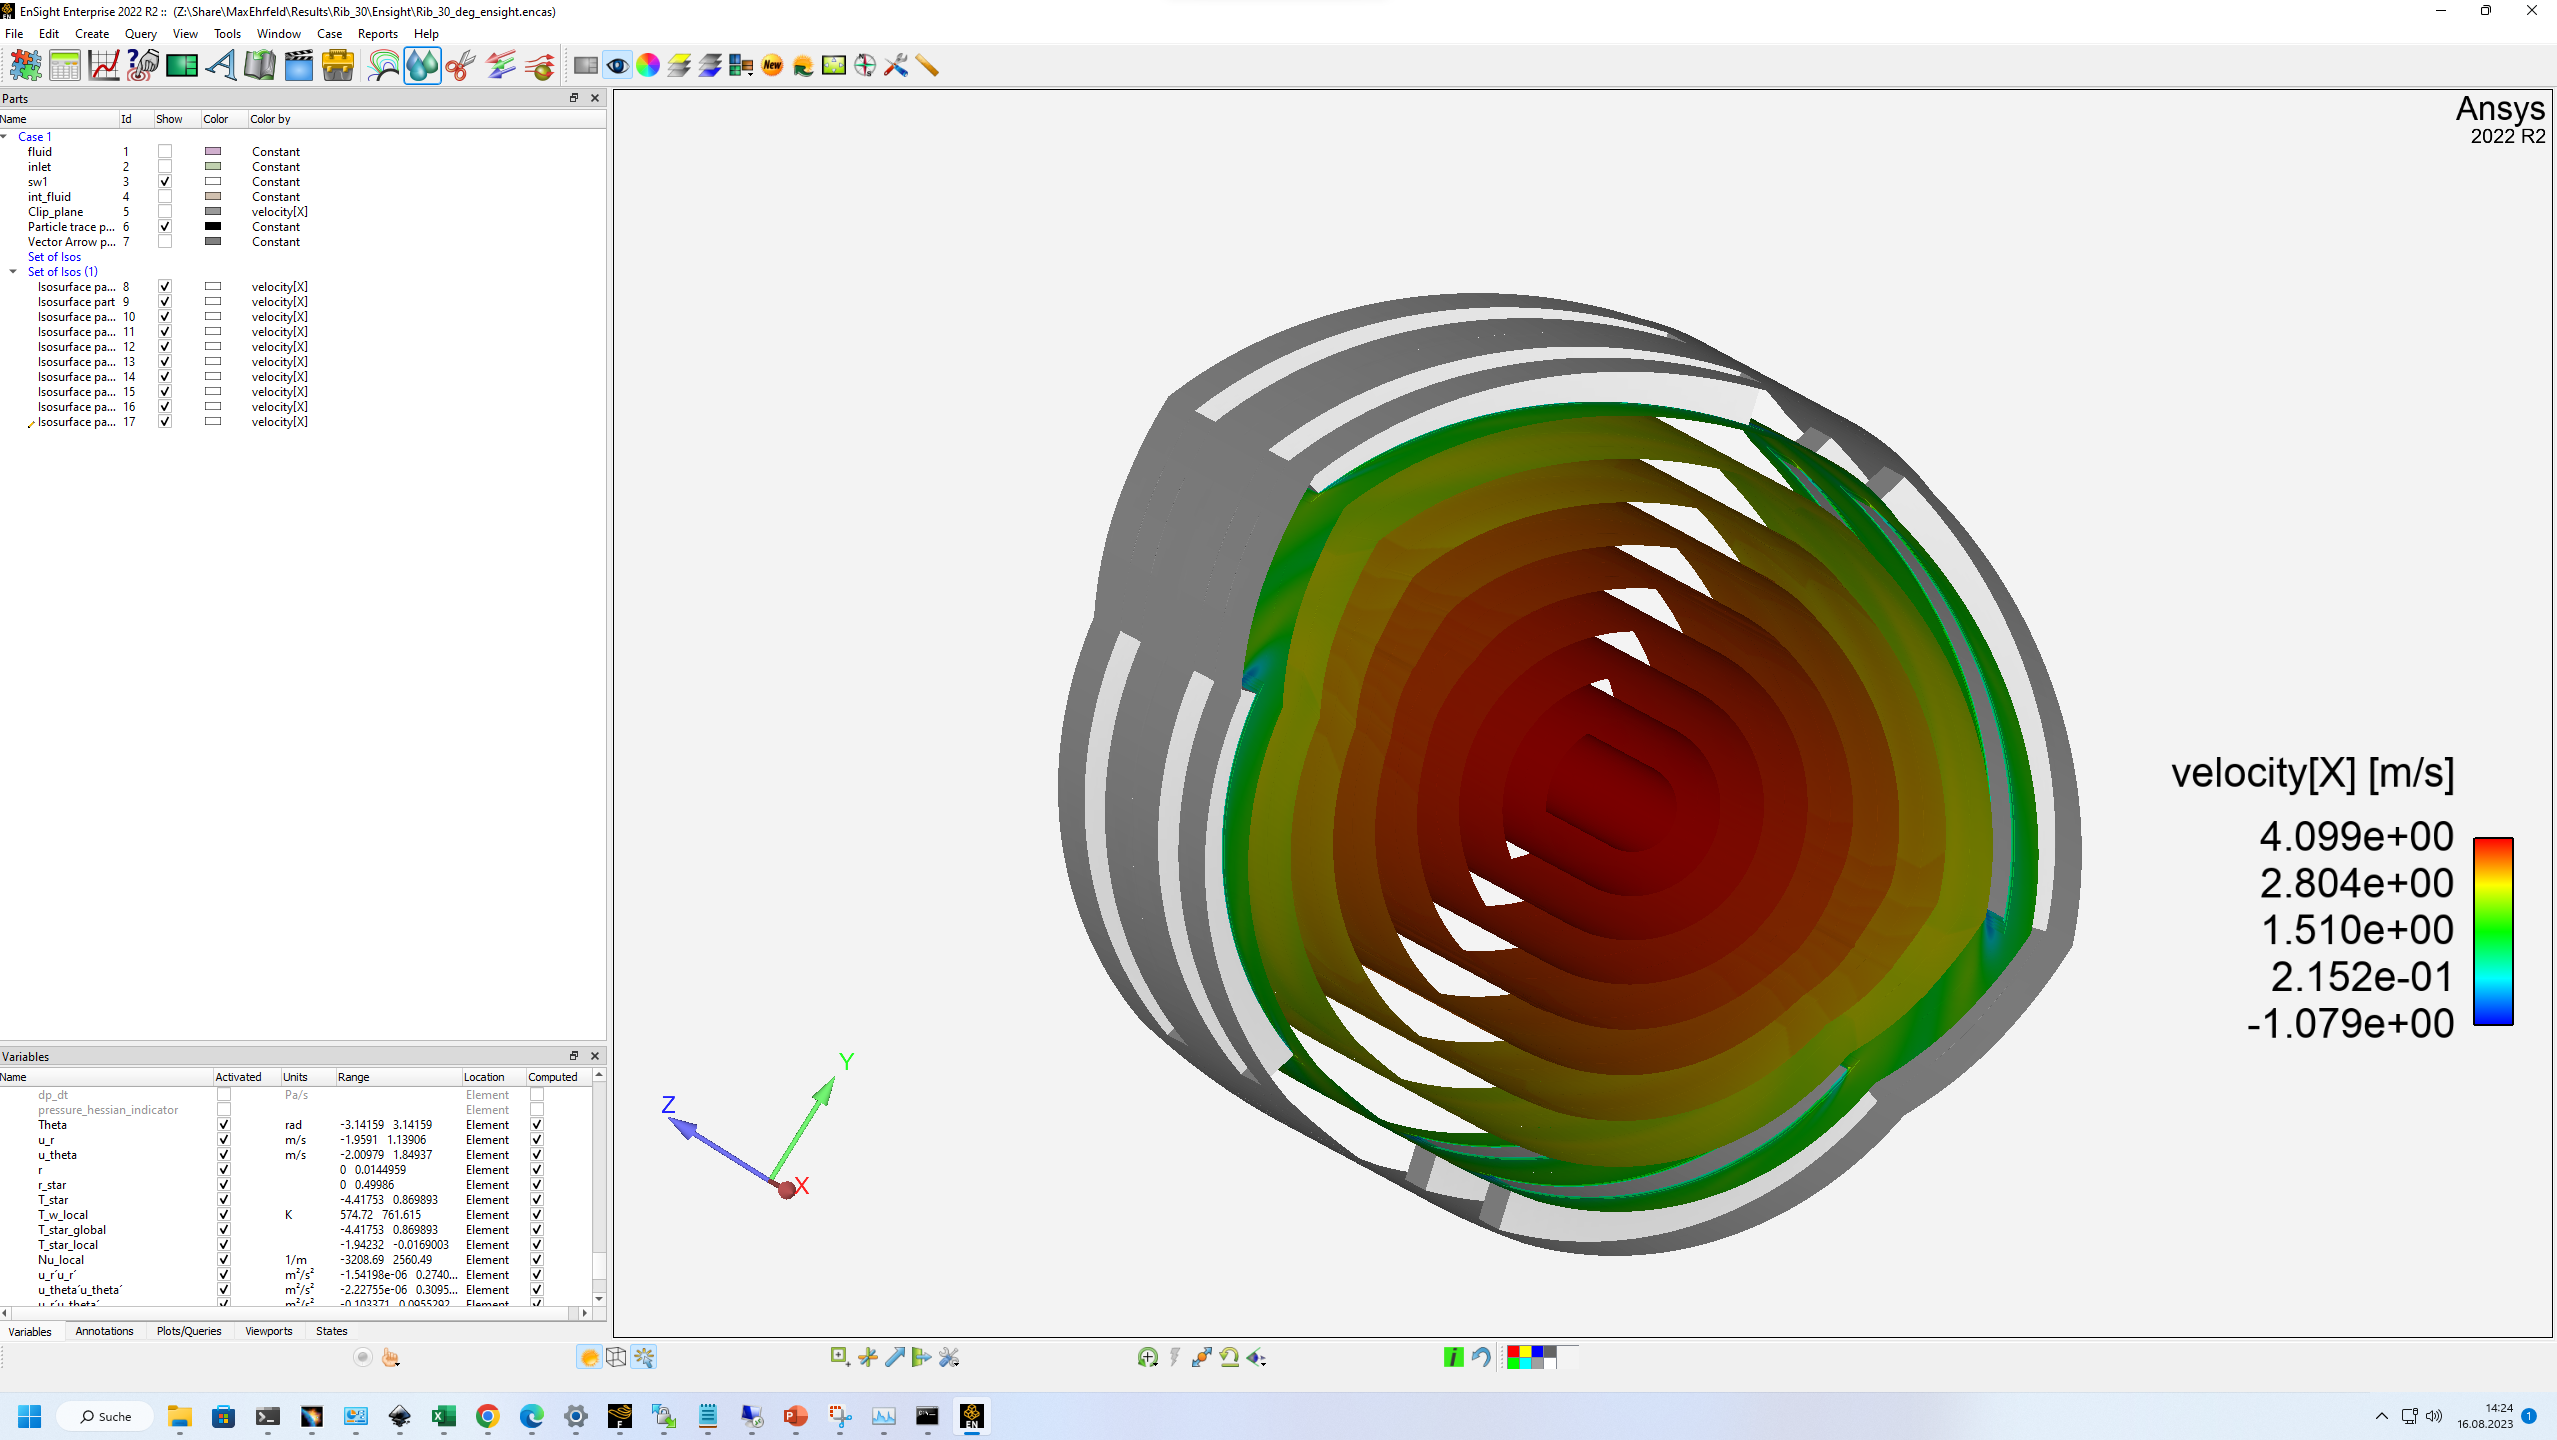
      I am postprocessing the thermo-fluid simulation of a rib roughened pipe with a structured grid in Ensight. The simulation was solved in Fluent with periodic boundary conditions, hence the jagged nature of the interface.

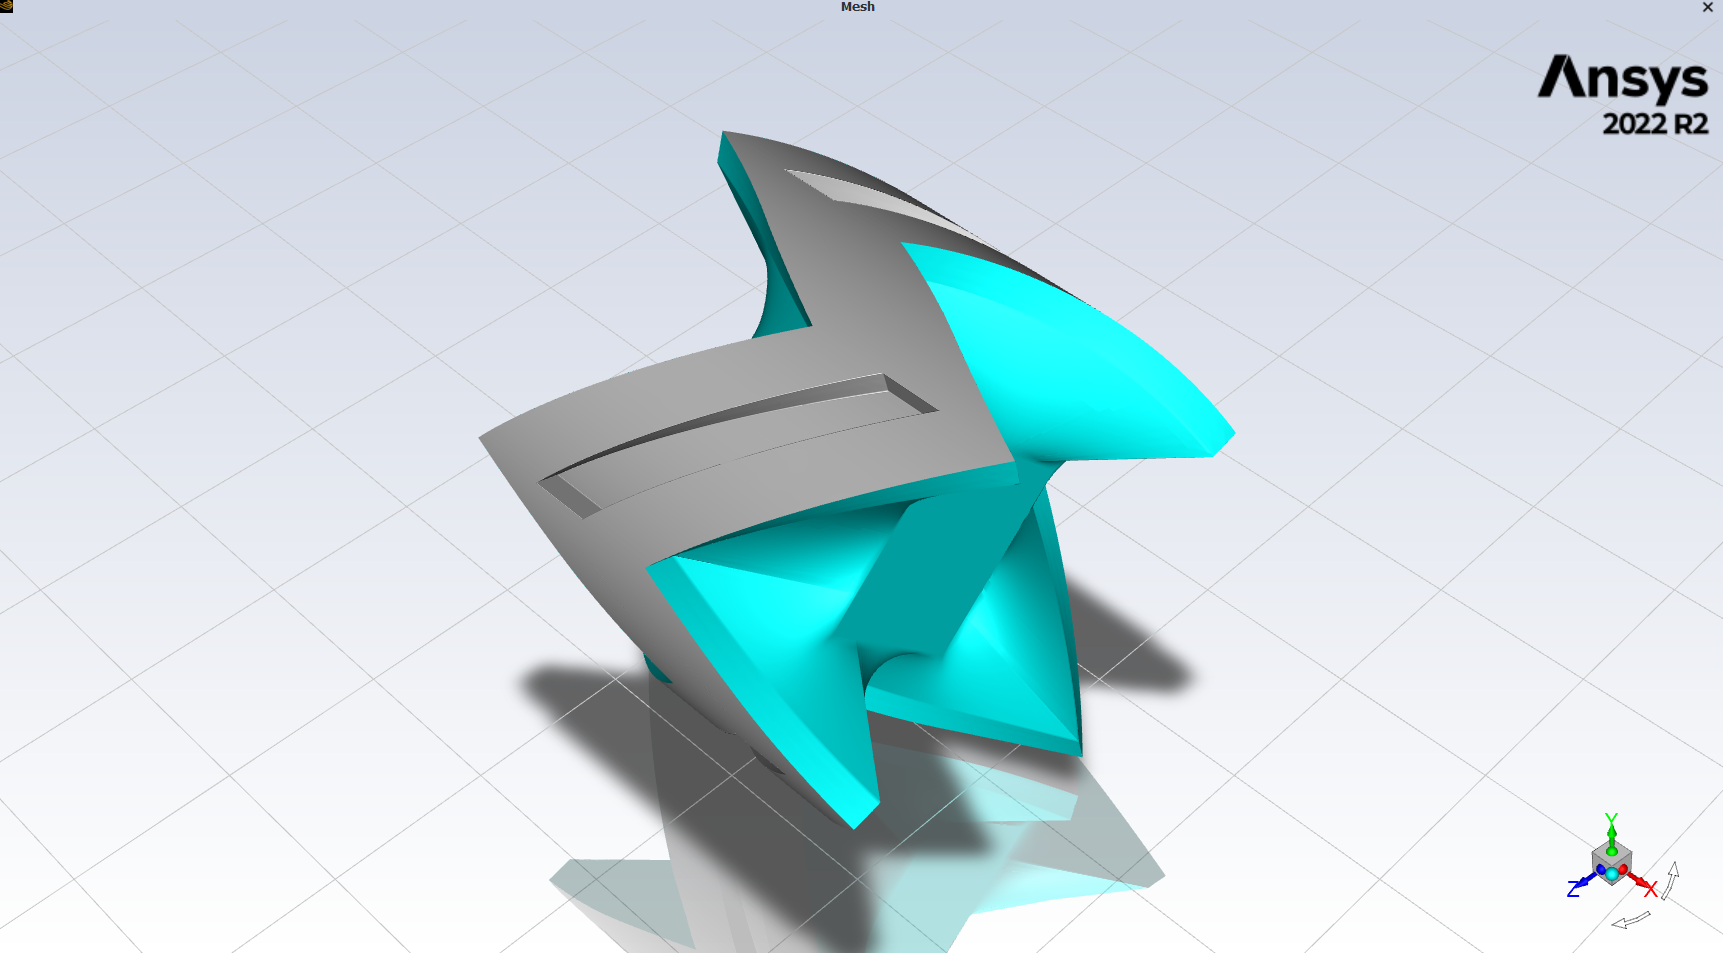
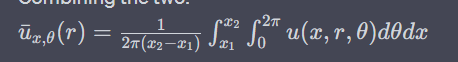
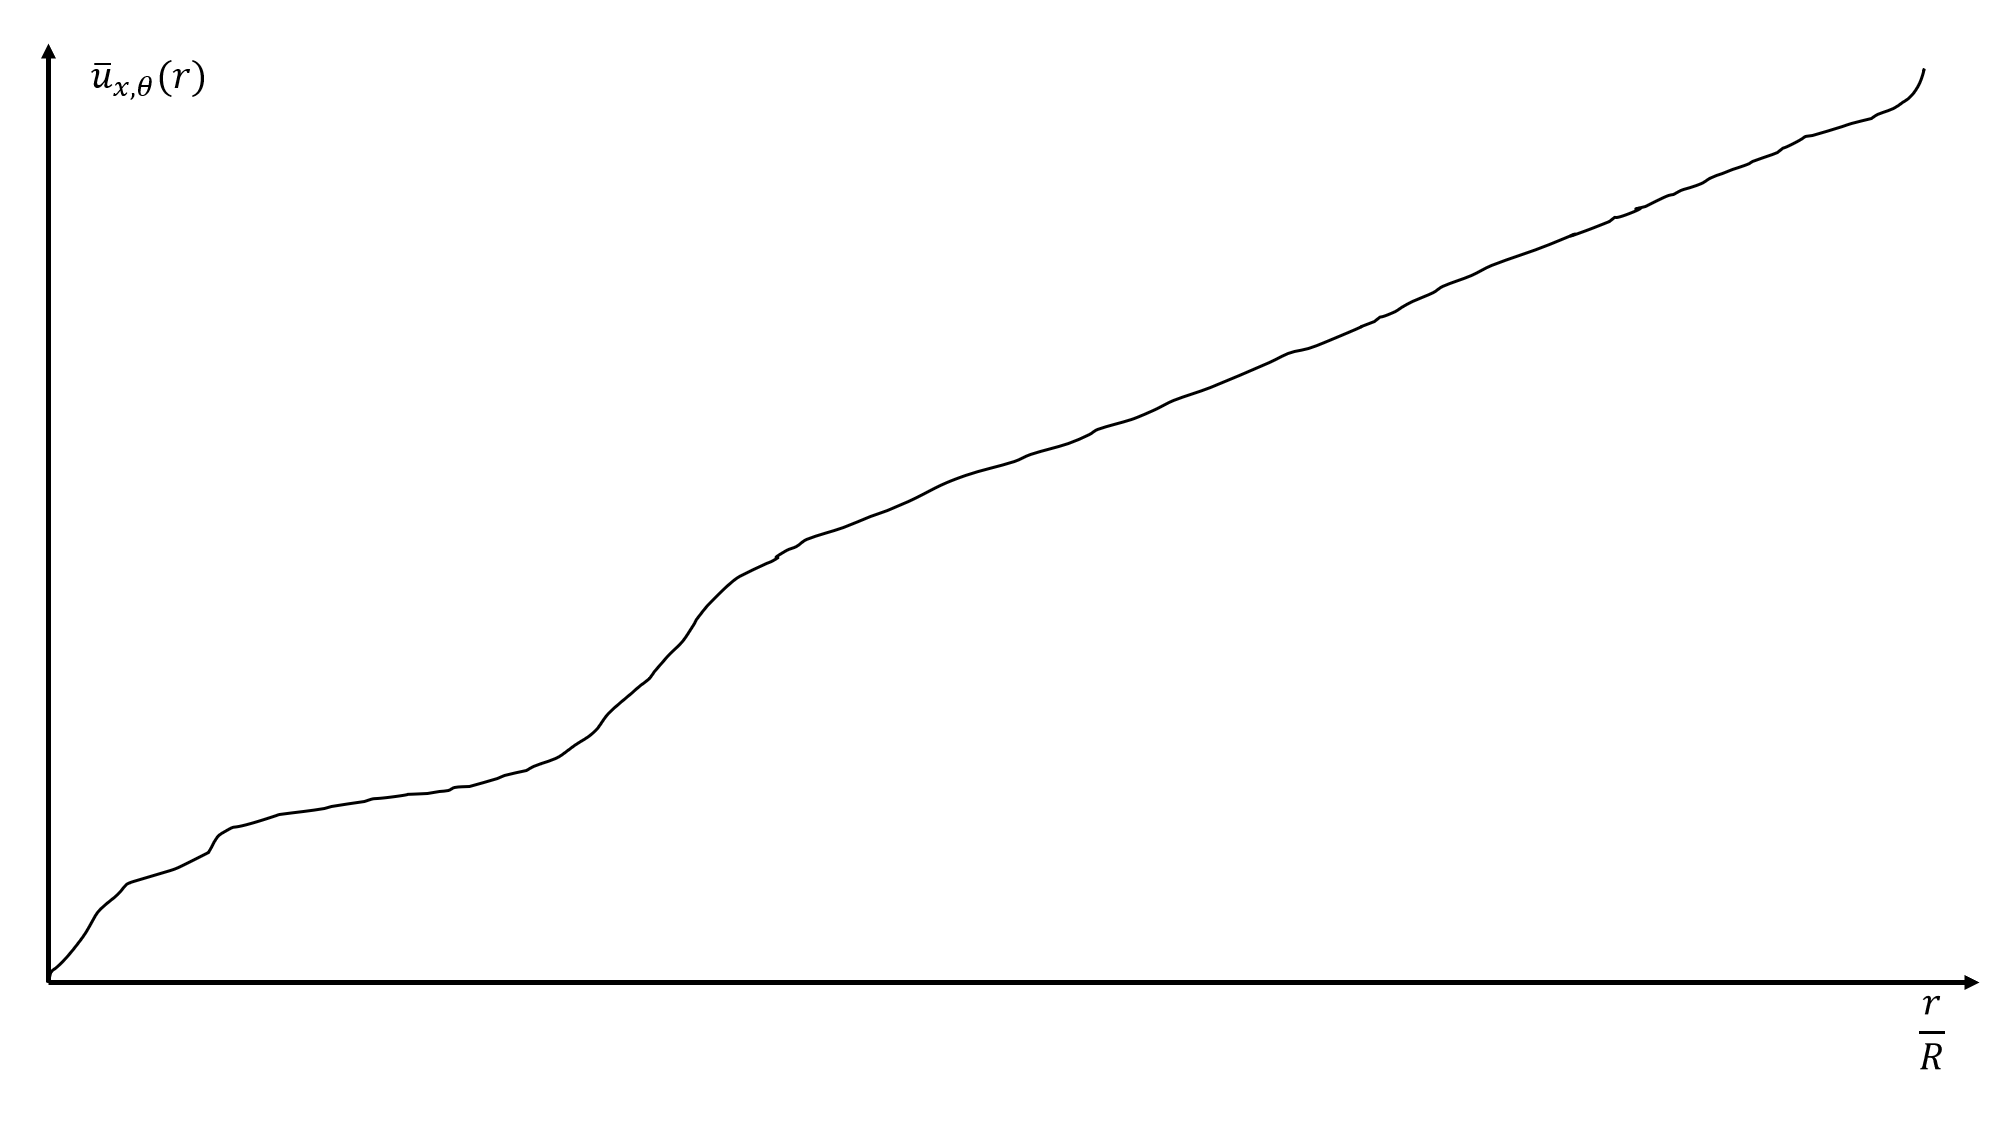
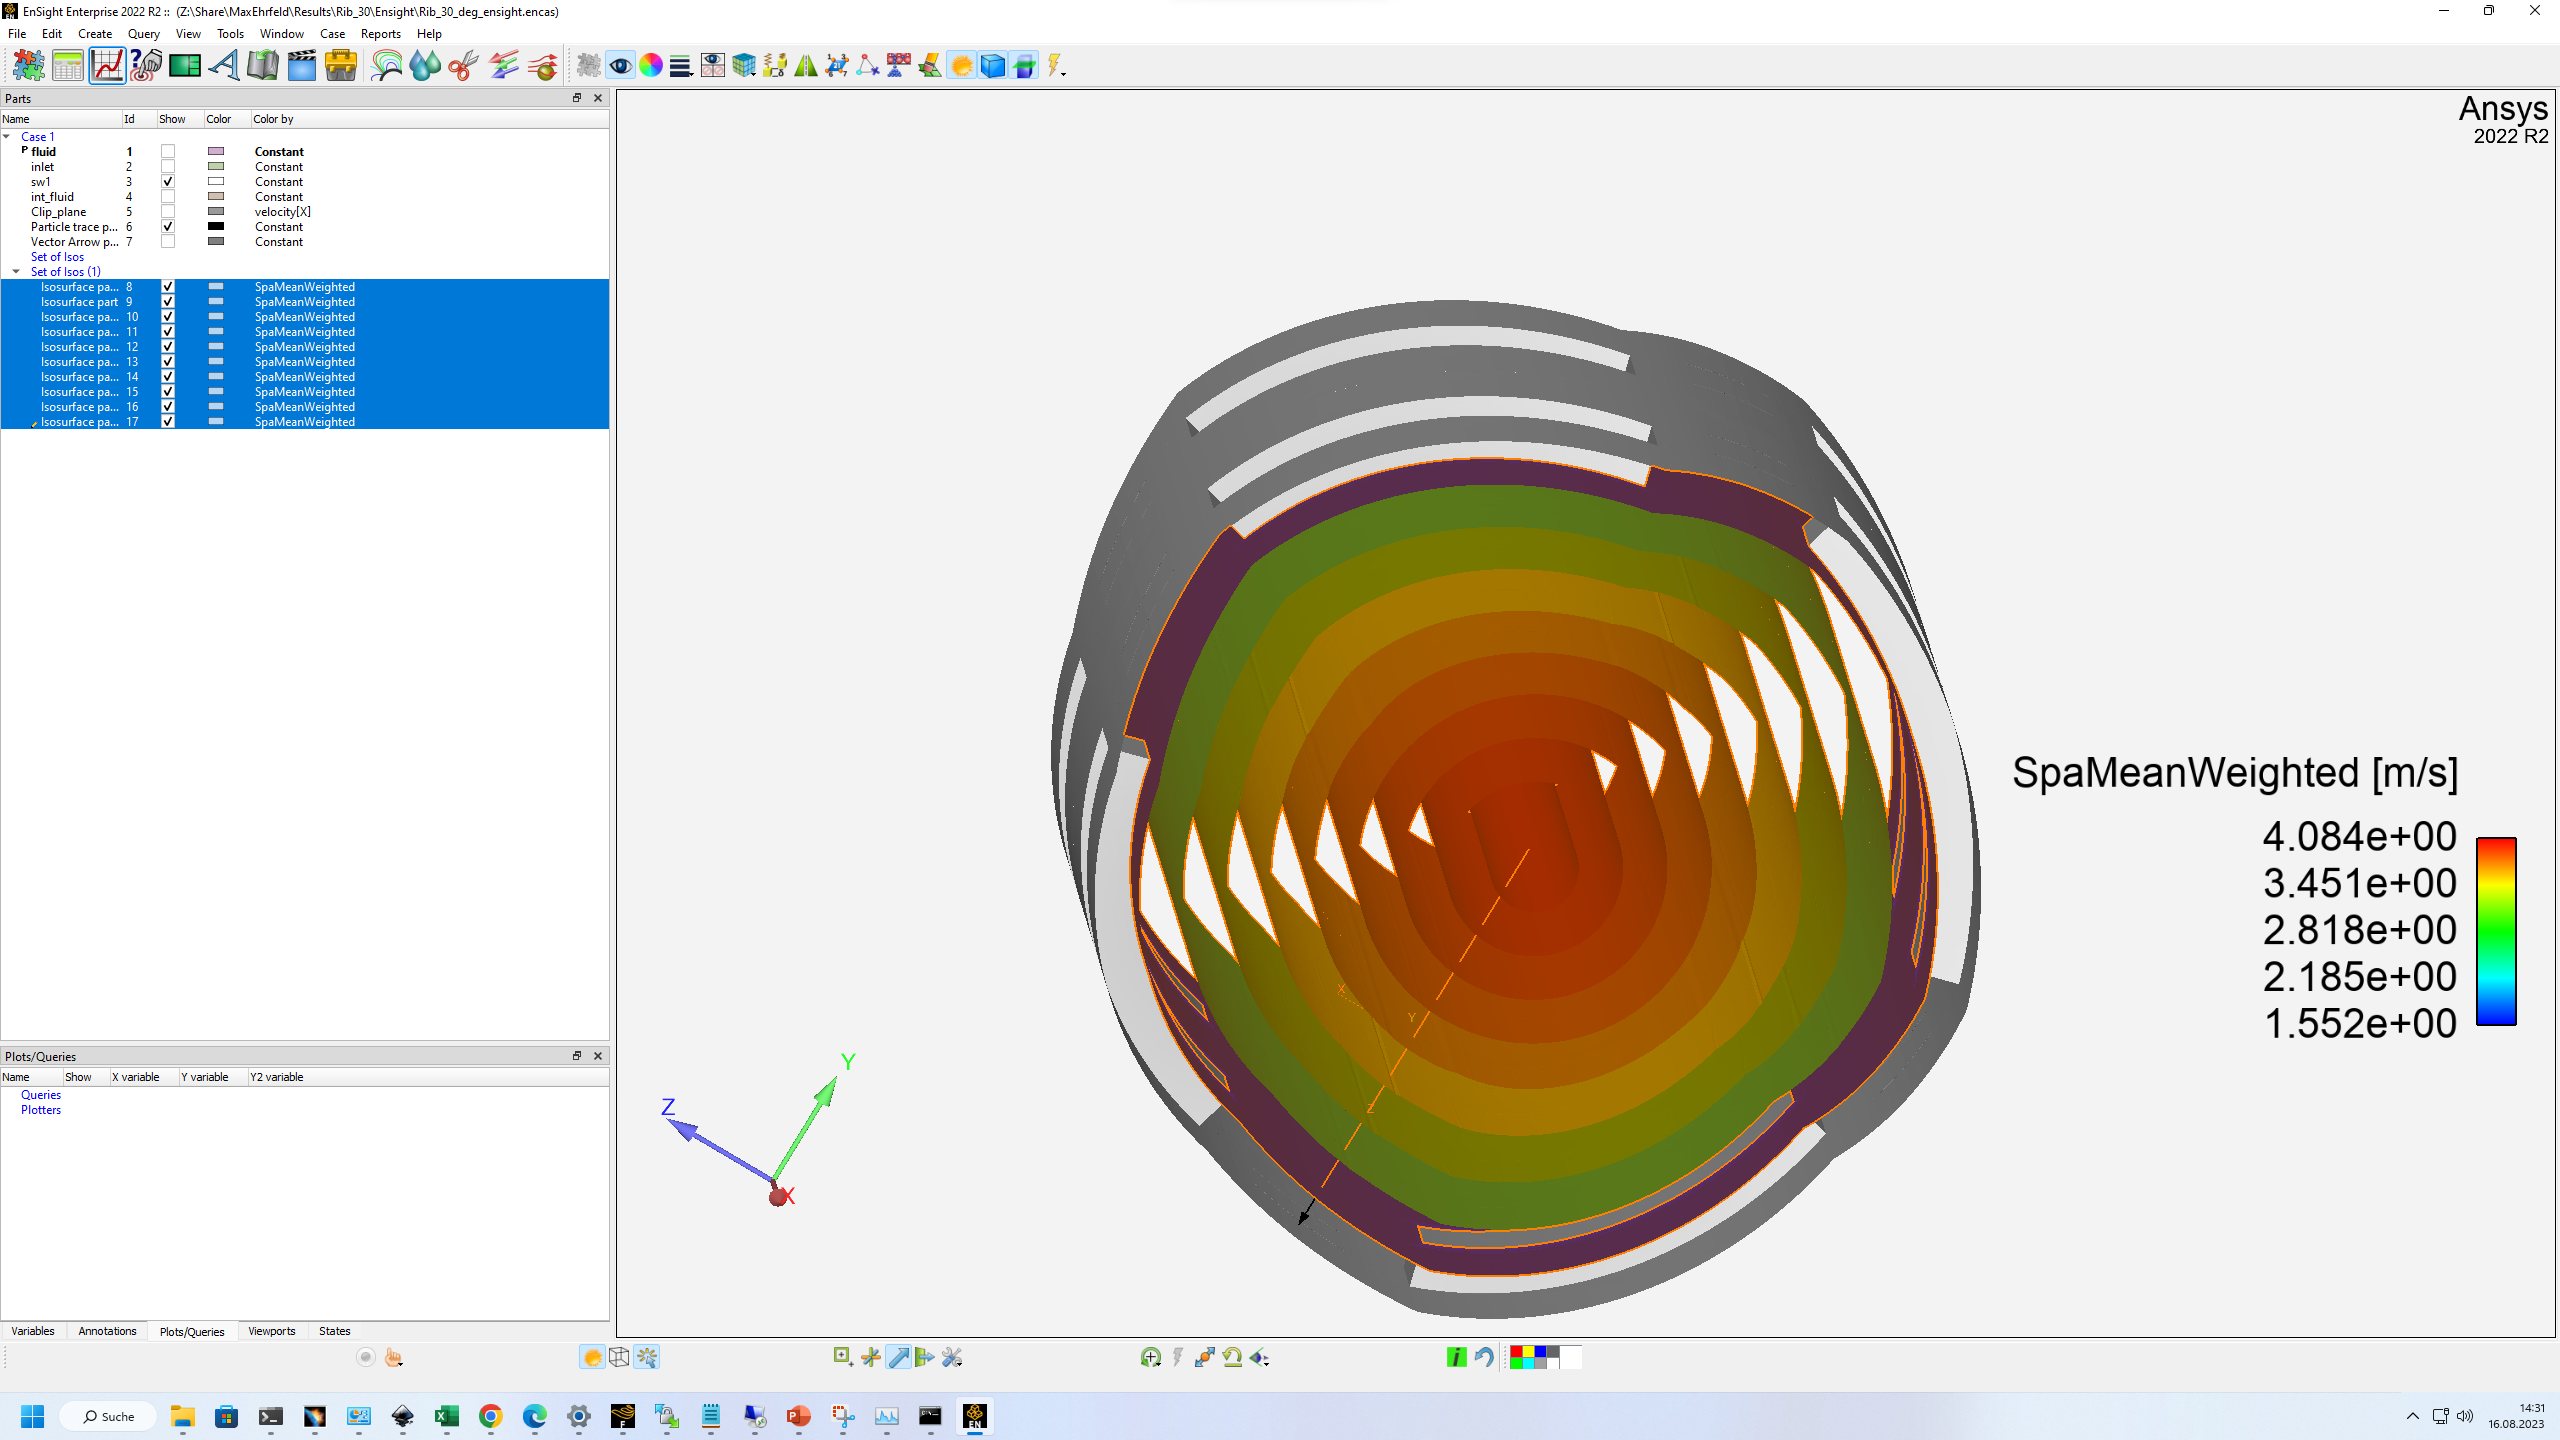
      I want to calculate the averaged axial (x) velocity over the radial coordinate of the pipe. Averaging in x direction was possible with a clip along the x axis to one outer wall and the radiograph mesh function and dividing the result by the length of the section. However, I cant figure out how to average the theta (circumferential) direction. Adding many clips along the circumference and manually averaging would be extremely laborious, as I have several variations of the geometry, and the radiograph mesh function takes quite long in itself to plot. Is there a smarter way to do this in ensight?

      Thank you for your help,

      Max

    • Rob
      Forum Moderator

      I'm not sure I follow what you're after. Do you want to average a value on a line on a specific axial plane but for a specific radial value? Ie the value on a hoop somewhere in the domain?

    • Max Ehrfeld
      Subscriber


      I am itnerested in the average x velocity, averaged over both the length of the pipe as well as the circumference. I want to treat the ribs as a statistical roughness. For this I need to plot the average radial x-velocity profile. so basically the integral below


    • Rob
      Forum Moderator

      Please post an image. You should be able to create isosurfaces of constant radius (ie cylindrical faces) and report on those. 

    • Max Ehrfeld
      Subscriber

      So the plot i want to generate will look something like this

      A Screenshot from ensight is below

      Do you mean create a function for the spatial average of the variable of interest, and evaluate that over surfaces of constant r, with a sufficient amount of isosurfaces to represent an average? That sounds like a good idea. How can i then create a plot from this data in Ensight? putting a Line tool perpedicular to the isosurfaces produces an error. Thank you very much for your help thus far

    • Rob
      Forum Moderator

      Not sure. In Fluent I'd create the iso-surface(s) of constant radius and then create an iso-surface of constant axial position whilst the radial surface was selected to leave a line. Then report data on that. Can you replicate that in Ensight? 

    • Max Ehrfeld
      Subscriber

      I am not sure that works in ensight, but I can report the values of the isosurfaces to a csv file, and then plot them externally, which might be quickest. Thank you, you helped me out a lot

Viewing 6 reply threads
  • The topic ‘Radial averaging along complex pipe geometry’ is closed to new replies.