TAGGED: -waveguide, 3DFDTD, computation-time
-
-
November 23, 2024 at 12:36 am
naveen.kumar
SubscriberHi,
I am simulating a Silicon waveguide with surface roughness (wrapped by SiO2). width=500nm (x-axis), height=220nm (y-axis) and length=2um/10um (z-axis). I am using 3D FDTD for the simulations. Source details are attached below. My 3D FDTD region is 12nm in X-axis, 8nm in Y-axis and whole region in Z-axis. I have checked that the mode profile is showing 1e-10 (color bar) around 2.5nm in x and y direction. The mesh accuracy is 3 and the autoshutoff is default 1e-5. I am also using the input, transmission DFT monitor and mode expansion at the given locations.
Zmin=0;
addmode;
#?set;
set('injection axis', 'z-axis');
set('direction', 'forward');
set('z', Zmin+0.02e-6);
set('x span', X_span);
set('y min', Ymin); set('y max', Ymax);
set('set wavelength',1);
set('wavelength start', wavelength);
set('wavelength stop', wavelength);
set('mode selection', Mode_Selection);
set('optimize for short pulse',0);
updatesourcemode;
addpower; # Power monitor, input
set('name', 'input');
set('monitor type', '2D Z-normal');
set('x span', X_span);
set('y min', Ymin); set('y max', Ymax);
set('z', Zmin+0.02e-6);
set("override global monitor settings",1);
set("partial spectral average",1);
set("total spectral average",1);
addpower; # Power monitor, output
set('name', 'transmission');
set('monitor type', '2D Z-normal');
set('x span', X_span);
set('y min', Ymin); set('y max', Ymax);
set('z', Zmax-0.1e-6);
#set('frequency points',10);
set("override global monitor settings",1);
set("partial spectral average",1);
set("total spectral average",1);
set("output Px",1);
set("output Py",1);
set("output Pz",1);
addmodeexpansion;
set('name', 'expansion');
set('monitor type', '2D Z-normal');
set('x span', X_span);
set('y min', Ymin); set('y max', Ymax);
set('z', Zmax-0.1e-6);
set('frequency points',10);
set('mode selection', Mode_Selection);
setexpansion('T','transmission');
I am facing below mentioned issues.
a) My input DFT monitor, transmission (T) shows negative values. why?? If the waveguide length is 2um, I am negative negative values for all the surface roughness irrespective of the meshing, FDTD region or number of PML layers. For waveguide length 10um, I am getting negative values for roughness (sigma_rms) more than 6nm.
b) How to calculate the propagation loss in such a cases? Is there a reliable way to calculate the propagation loss, scattering loss, radiative loss, absorption, etc. Any formula or any monitor that can provide me these values.
c) To simulate the FDTD, I have defined fine mesh regions around the roughness and coarse mesh at other regions. The simulations are taking 40-70hours for a single simulations on a 32 thread CPU even if all the CPUs are assigned to one simulation. Is there a way to reduce the simulation time? I have already tried with mesh override but I lose significant accuracy for higher surface roughness.
d) It is possible to simulate a short rough waveguide and then use the output of DFT monitor at the end of first waveguide to use as a source to simulate the similar short waveguide in a different simulation? If yes, kindly guide me through it. -
November 27, 2024 at 12:44 am
Amrita Pati
Ansys EmployeeHi Naveen,
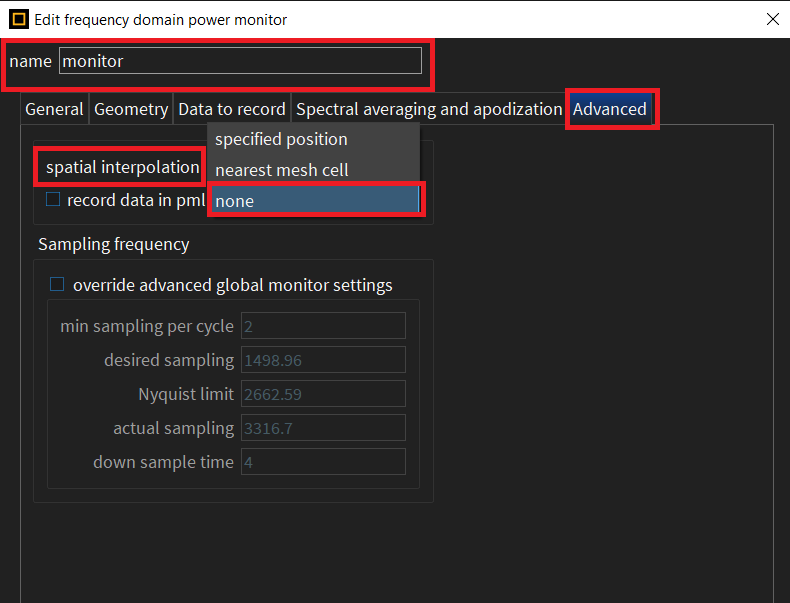
It looks to me like you're placing the monitor exactly where you are injecting the source. I think you should place it a few mesh cells in front of the source, as it takes a few mesh cells for the source to be injected (shown grey area around the source). Or you may try a "port" instead (of mode soruce+monitor) and see the T result from there. In general surface roughness is tricky to simulate. As you mentioned, it takes finer mesh to resolve some of the features otherwise we lose accuracy. Unless you have symmetry, I don't think there is a lot more we can do to reduce the simulation time. You can downsample some of the monitor data to save some time/memory, but I don't think it will make a large difference. Would you be able to share a screenshot of the overall simulation geometry? On your last question: yes, you can do it with import source. Here is an example: Using monitor data to define the spatial field profile of a source in FDTD. Using an import source requires some additional considerations to limit the amount of source injection errors, for ex. making sure that the location of the monitor in the 1st simulation and the 2nd import source in the 2nd simulation are at the exact same location. We also recommend using the same mesh (at the location of monitor in the 1st simulation and source in the 2nd simulation) to avoid any aritificial reflections when you inject the source. Also, it is recommended to turn off interpolation in the monitor (whose data will be used in the 2nd simulation) of the 1st simulation to reduce interpolation error.
Regards,
Amrita -
November 30, 2024 at 3:06 pm
naveen.kumar
SubscriberHi,
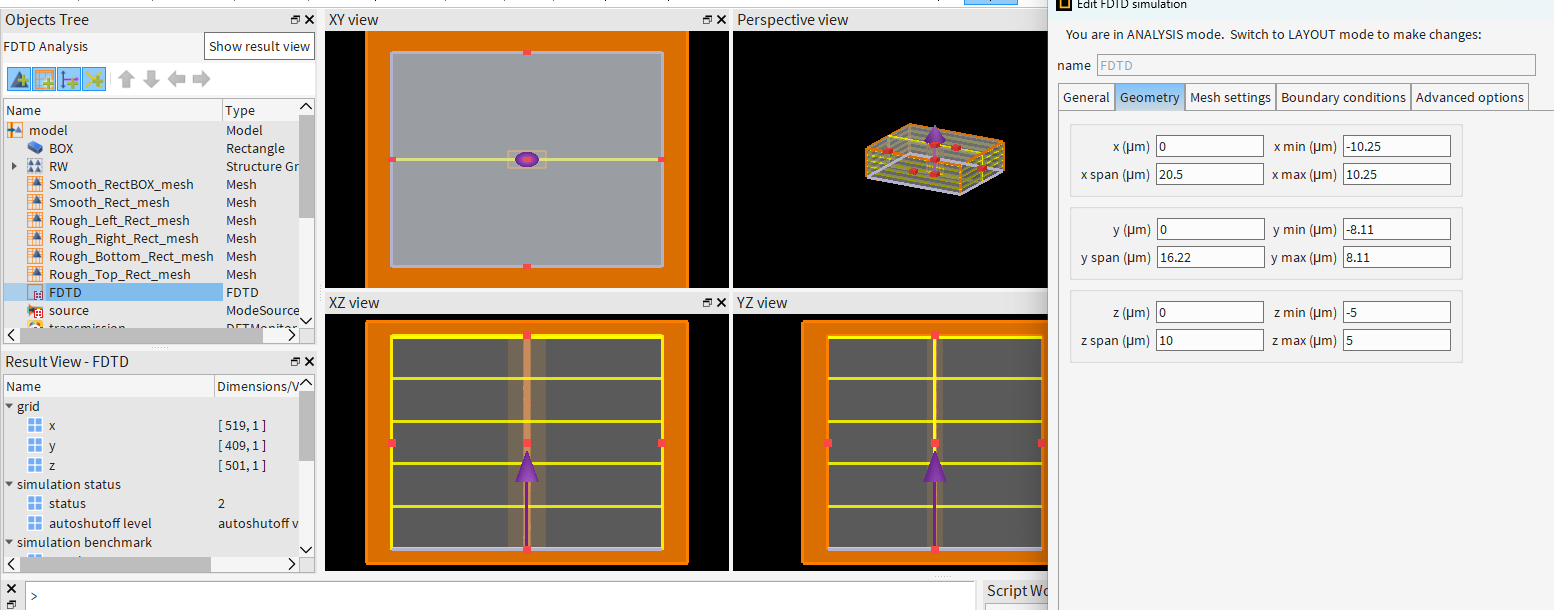
The simulation geometry is quite big. X=20.5ym, Y=16.22um and Z=10um as shown in the figure. I will try to use cluster to run the simulations.
I have a few questions, as I am using PML boundaries and it can be seen that PML boundaries are very close to the DFT monitor at the input and Mode expansion monitor at the output. Does changing the number of PML boundaries also changes the results? Is it still possible to have reflection, if I am considering 48 PML boundaries?
Shall I move away the simulation region (PML Boundaries) from the input and output location as well, i.e, in the propogation direction? What may be the ideal distance between the monitor and PML boundaries to keep the reflection min (atleast 4-5 order less)?
When I consider the ports, does it provide the results in Fundamental model or in total power/transmission?
It is possible to accurately capture the scattered power/transmission from the surface roughness perpendicular (X-Y plane) to the propogation direction (Z axis)? How?
Can I also simulate the surface roughness in VarFDTD? -
December 3, 2024 at 6:54 pm
Amrita Pati
Ansys EmployeeHi Naveen,
The PML boundaries/number of PML layers can affect the results of the simulation. But it is very hard to tell if 48 layers are going to be enough for a given simulation as it is very specific to the simulation and depends upon a lot of parameters including the simulation size, the injected fields, the field profile. To reduce the amount of reflection from PML, as a rule of thumb we recommend that the monitors must be lambda/2 distance away from the PML boundaries. As an example, if the source wavelength is 1 um, make sure that you have 0.5 um between the PML and the monitor. I will recommend performing convergence testing with regard to the PML layers if you think they are affecting the results. In covergence testing, we run a simulation with increasing number of PML layers to make sure that the results converge but I understand that it can be difficult here, given that the simulation is taking so long. You could run another simulation with let's say 64 layers and see if the results are changing. That way we will know that the PML is affecting the results. As a workaround instead of simulating the whole device, reduce the size along the propagation length and then run the simulation for different PML layers and then see if that is changing the results.
Ports are a combinaion of mode source, DFT monitor, and mode expansion monitors. So, you can obtain the total transmission as well as the amount of transmission into specific modes of interest (You can select which modes you are interested in, not just the fundamental mode). The "T" result is the total transmission result. But the S-matrix gives you the coupling into the modes you selected.
It is possible to accurately capture the scattered power/transmission from the surface roughness perpendicular (X-Y plane) to the propogation direction (Z axis)? How?
You can calculate the transmission/reflection from the ports, but I am not sure how you'd capture the scattered fields accurately. Let me think about this a little bit and get back to you.
We shouldn't be using varFDTD for surface roughness. How varFDTD works is that it calculates an effective mode of the device based on the vertical permittivity profile, and then propagates this effective mode in 2D. As a result, it is generally used in flat optics where there is little to no vertical coupling between modes. The vertical profile will change with the consideration of surface surface roughness, this change won't be taken into account in varFDTD, since the effective mode is only calculated at one point in the waveguide structure. So, varFDTD will consider the geometry to be flat rather than having any roughness.
Regards,
Amrita -
December 8, 2024 at 12:15 am
naveen.kumar
SubscriberHi,
Thank you for the information. I will test the PML layers with convergence. Kindly help with capturing the scattering fields.
I am trying to run the simulations on clusters due to computation load and we are using Slurm workload manager. How can I run multiple FDTD simulations in parallel using the job submission script (SBATCH) (not via GUI)? Can I control the number of cores assigned to each parallel simulation? Is it possible to provide script file that generates the .fsp files and run those .fsp files simultaneously? Or I have to provide all the .fsp files in the job submission script?Best Regards
Naveen Kumar
-
December 10, 2024 at 10:25 pm
Lito
Ansys Employee@Naveen Kumar,
When you run with SLURM, your command to run multiple simulation files at the same time would be similar to this KB.
Example - run 2 simulations on 2 nodes using 32 cores per node per simulation:
#!/bin/sh
#SBATCH --job-name=lumtest%j
#SBATCH --nodes=2
#SBATCH --ntasks=64
#SBATCH --cpus-per-task=1
#SBATCH --ntask-per-node=32
#SBATCH --time=01:00:00
#SBATCH --output=lumtest%j.log

## change directory to the location of your simulation files
cd /{path to simulation files}

## set/configure/load MPI (consult IT/cluster admins)
## example below runs with OpenMPI - using default install path for Lumerical 2024 R2.3

mpirun -n 32 /opt/lumerical/v242/bin/fdtd-engine-ompi-lcl -t 1 {first_simulation.fsp} &
mpirun -n 32 /opt/lumerical/v242/bin/fdtd-engine-impi-lcl -t 1 {second_simulation.fsp} &
Hope this helps.
Lito
-
- You must be logged in to reply to this topic.


-
4999
-
1676
-
1387
-
1248
-
1021

© 2026 Copyright ANSYS, Inc. All rights reserved.


