Hi all
I'm simulating the suppressor in ANSYS Fluent and I have problems with my results.
suppressor is fed by a gear pump, and the mean mass flow rate is 2.87 kg/s. We extract the mass flow and velocity using sensors. You can see the setup of the experiment here:

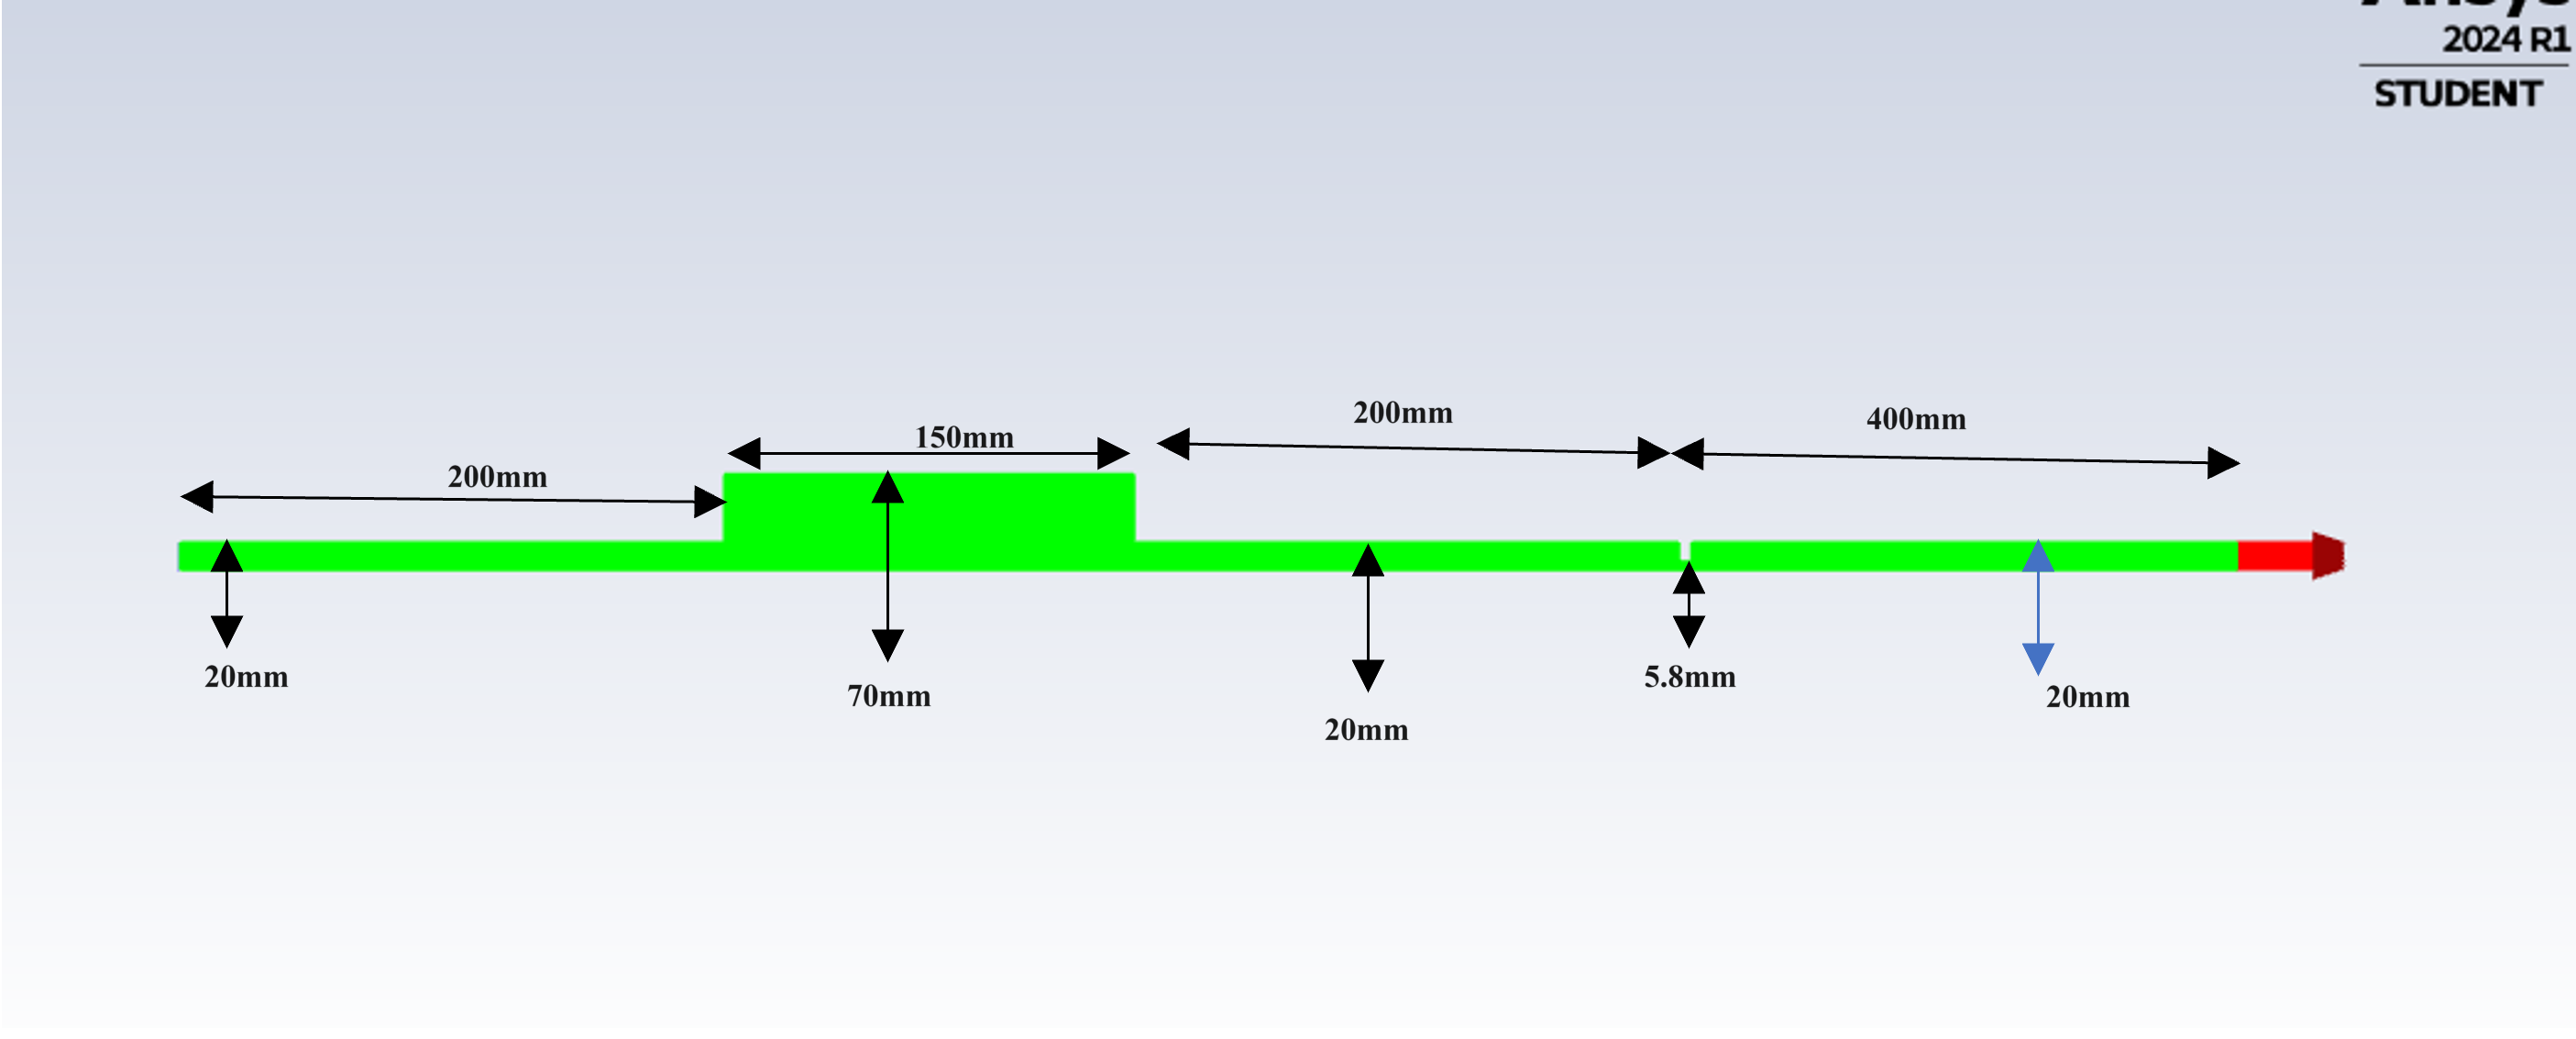
At the first step, I used the simple geometry that included the simple pipe with the chamber in the middle to see the pressure difference before and after the chamber, but to get a constant pressure at the outlet, I used an orifice with a diameter of 5.8 meters, and after the orifice, I extended the geometry to have a fully developed rejime and set a constant pressure of 5 bars for the outlet. I use a velocity inlet with UDF to set the inlet as a pulsative velocity. Here are my UDF and geometry.
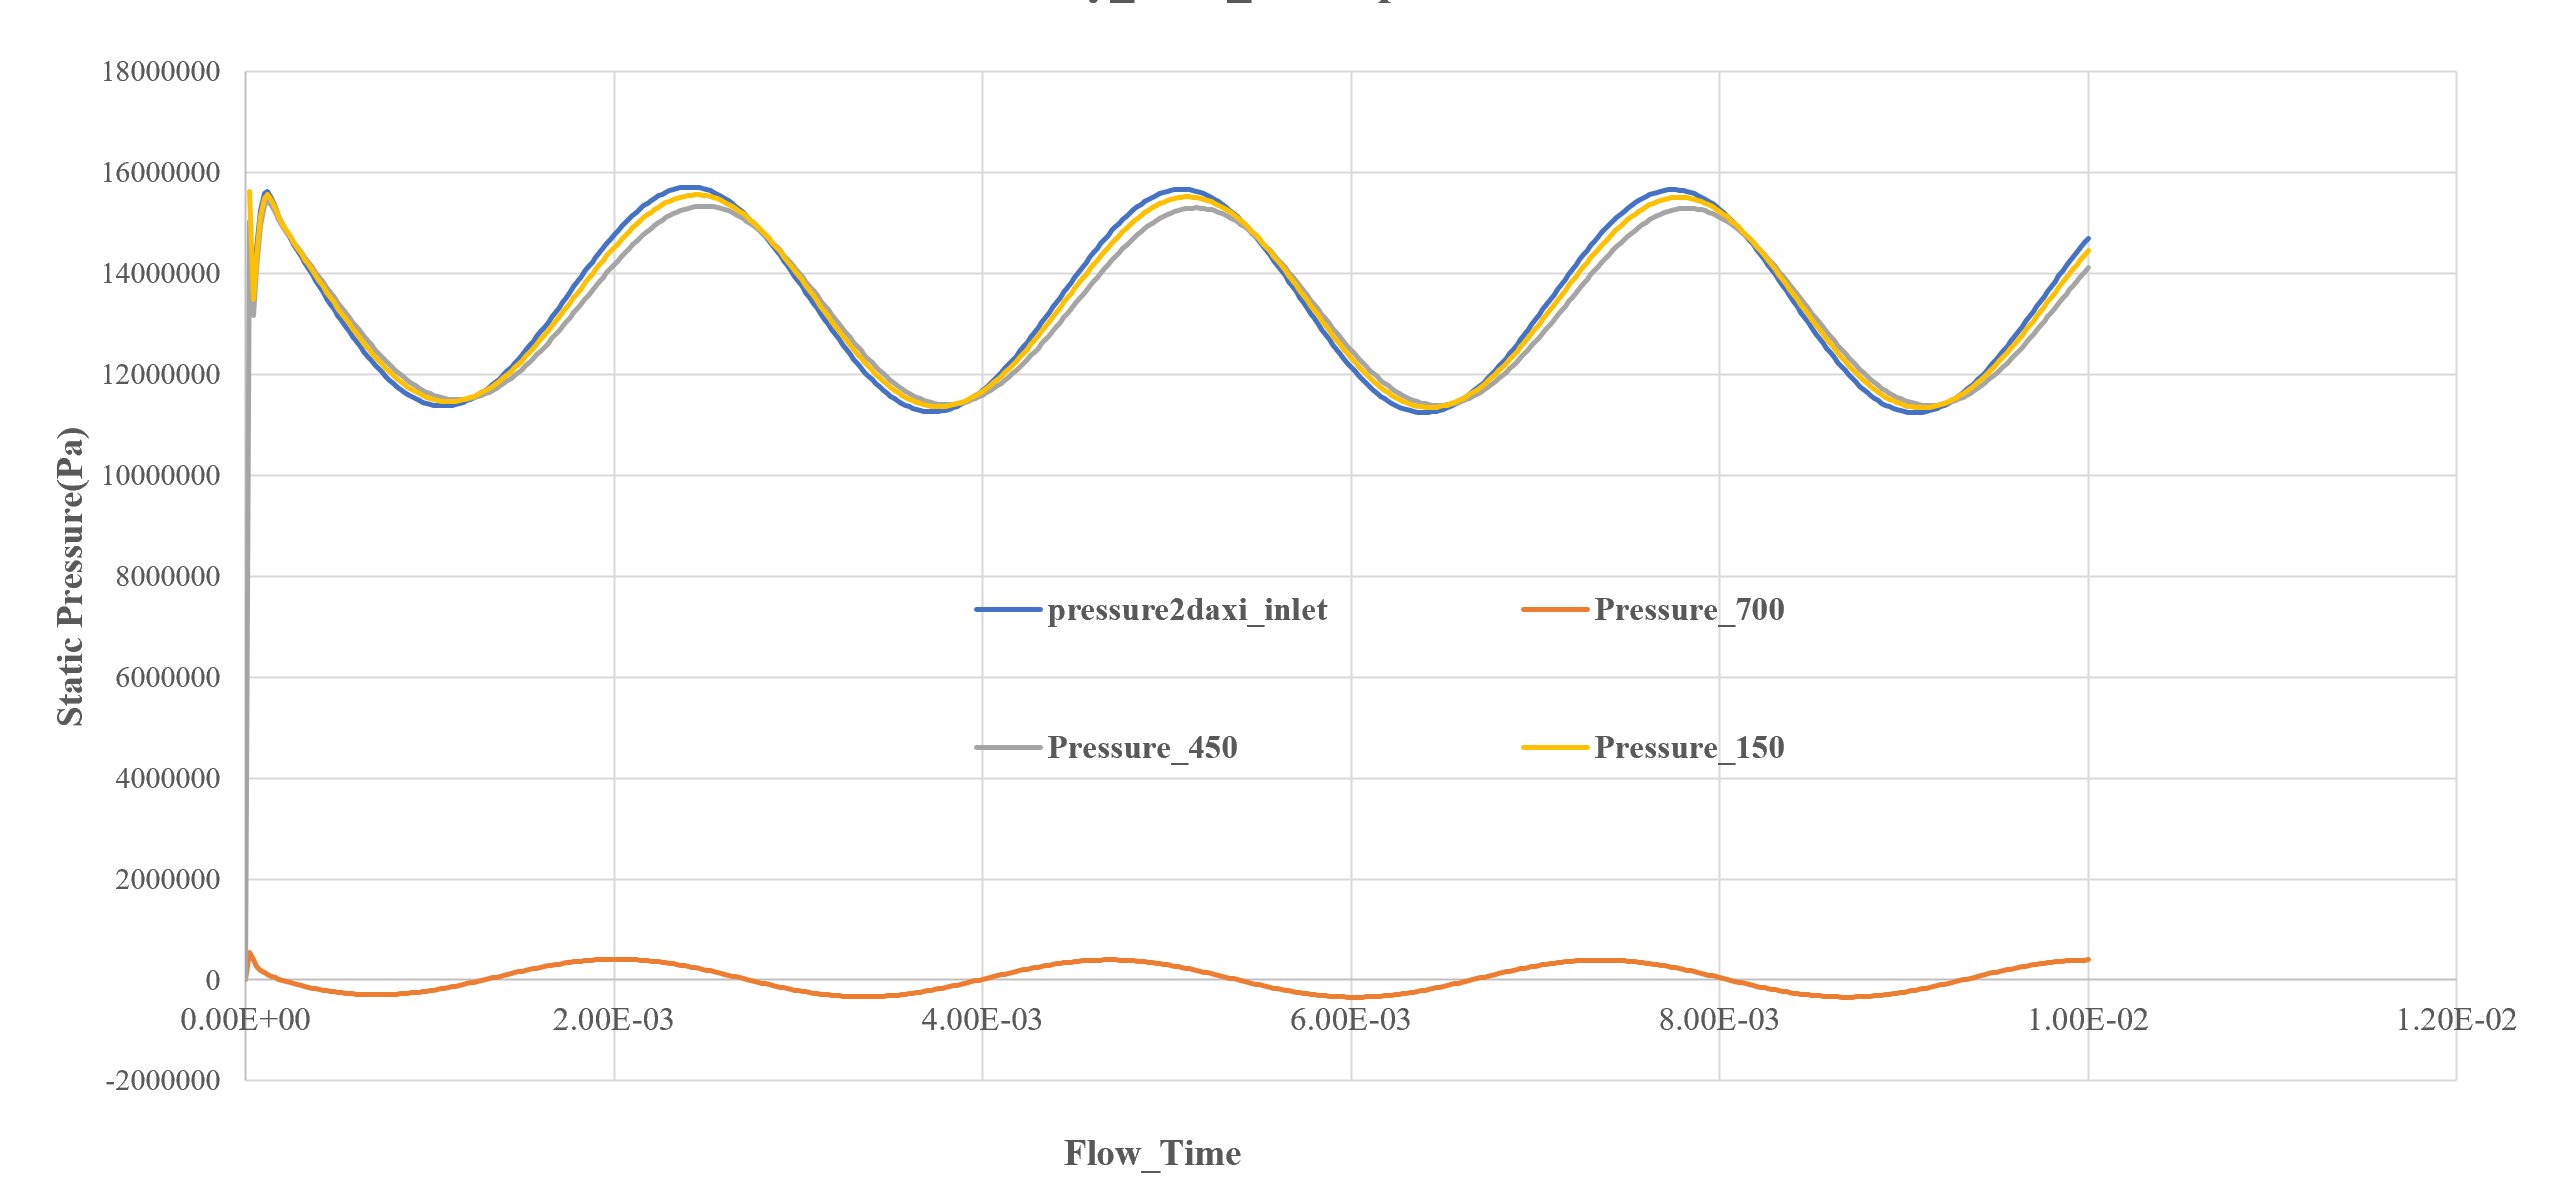
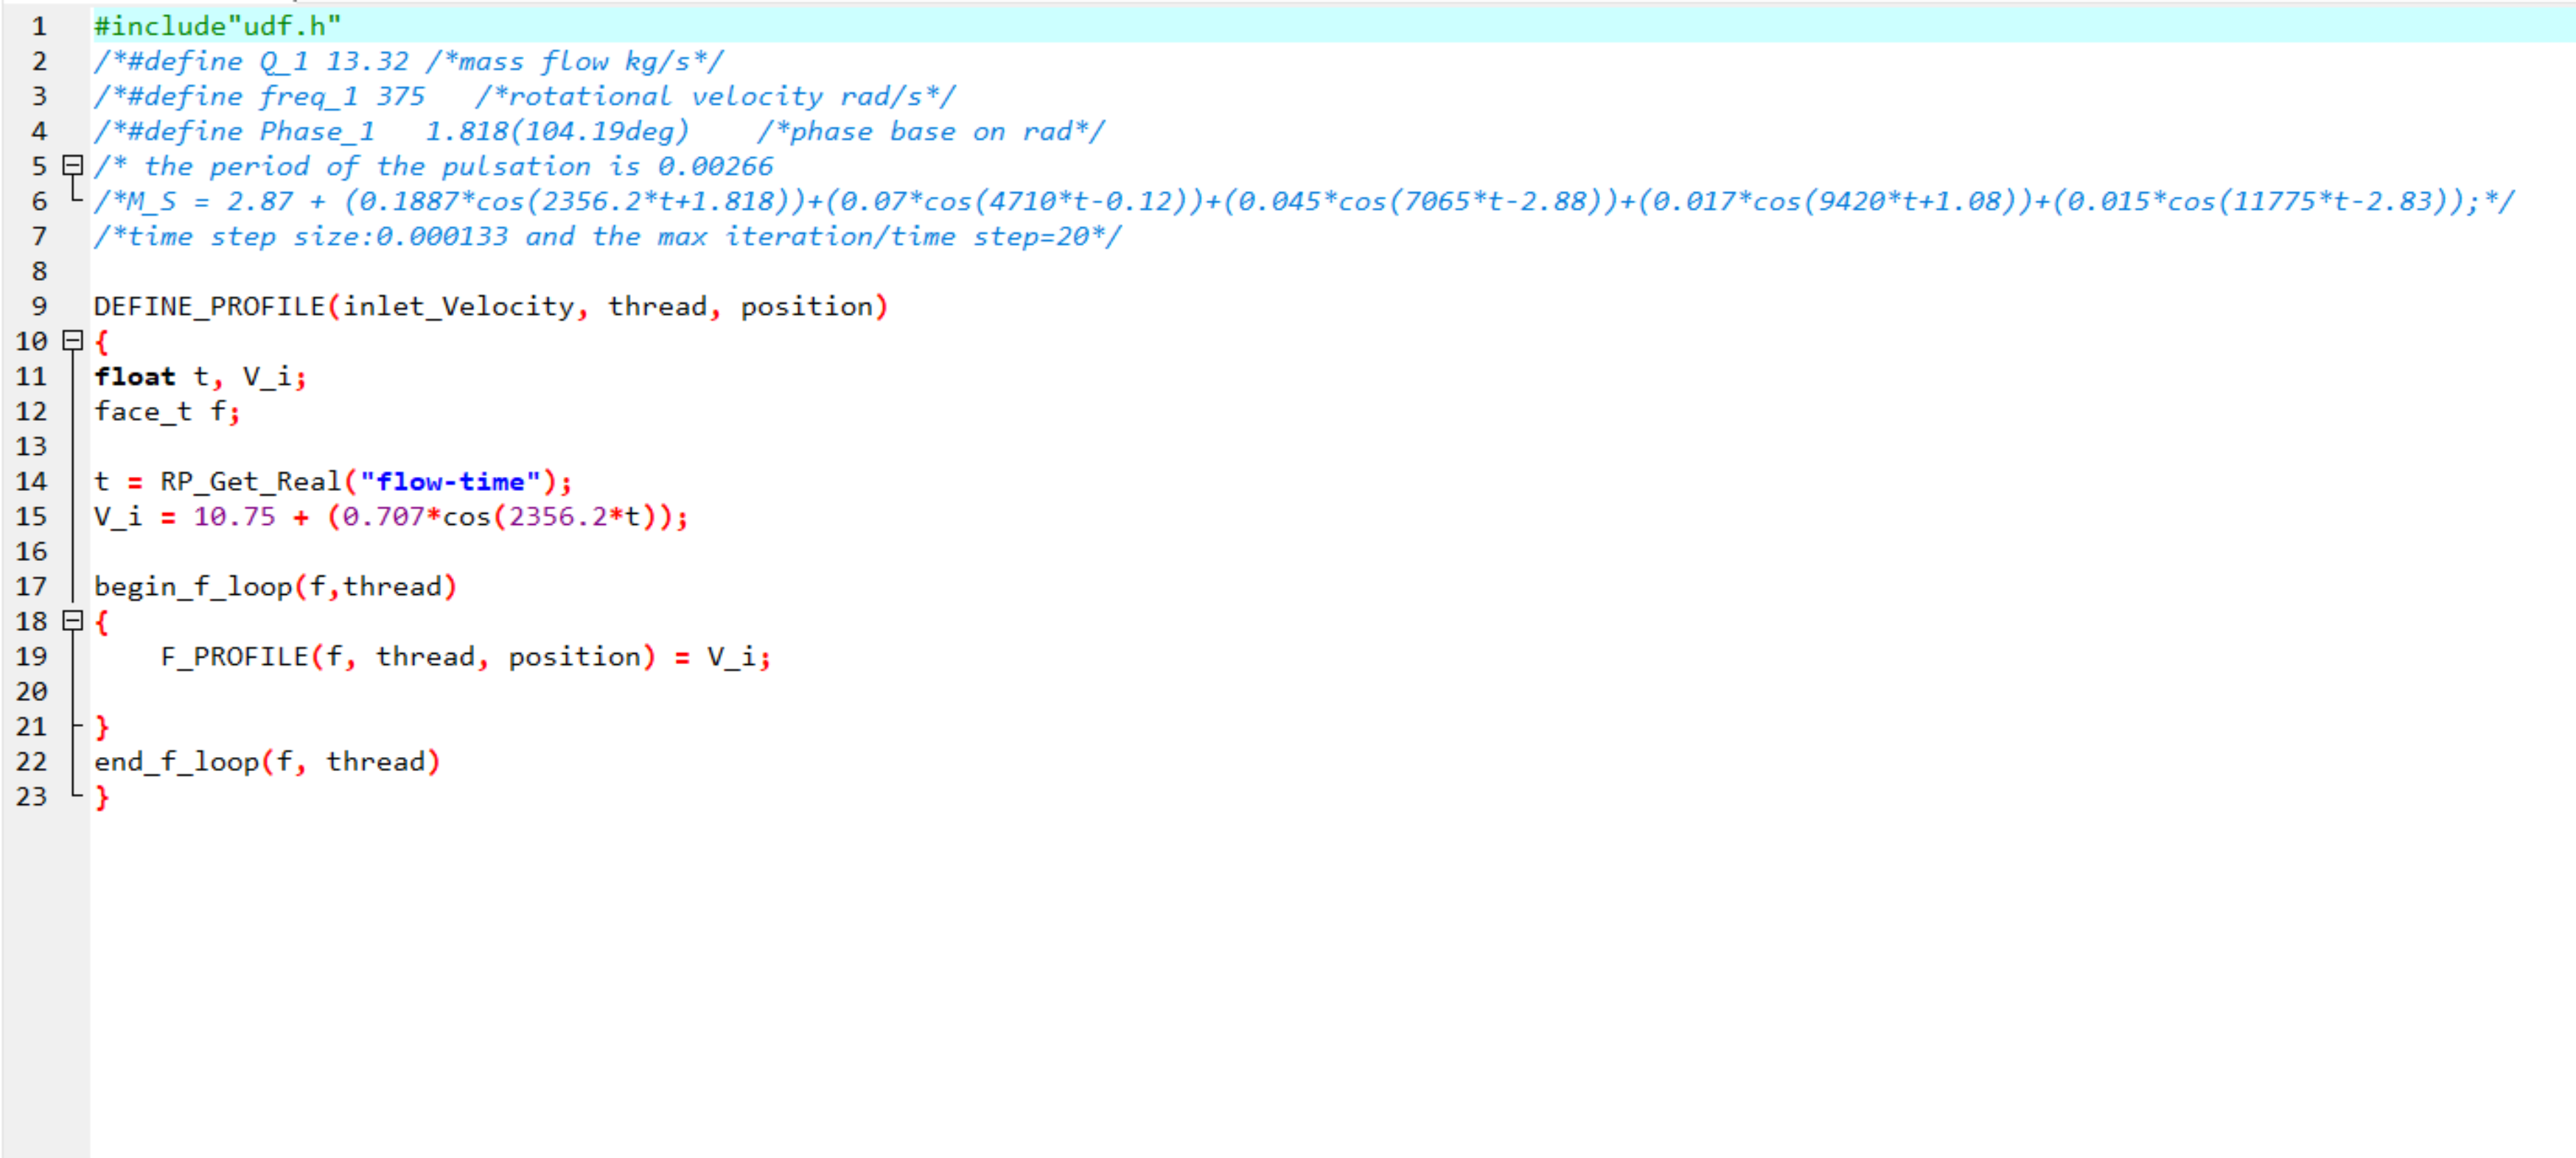 After this, I extract the pressure-time charts before and after the chamber, as well as at the inlet and after the orifice. but the pressure amplitude is very high, and I don't know why. My fluid is hydraulic oil with an 850 Kg/m^3 density and 0.039 dynamic viscosity. My frequency is 2356 rad/s (you can see it in Velocity UDF). I use 1e-6s for the time step. Here are my results.
Anyone who can help me decrease the amplitude of pressure or tell me where I am doing wrong???
pressure400=pressure after chamber
Pressure 700=pressure after orifice
pressure150=pressure before chamber