TAGGED: mechanical, random-vibration, vibration
-
-
November 7, 2023 at 10:12 am
Matthew Kirby
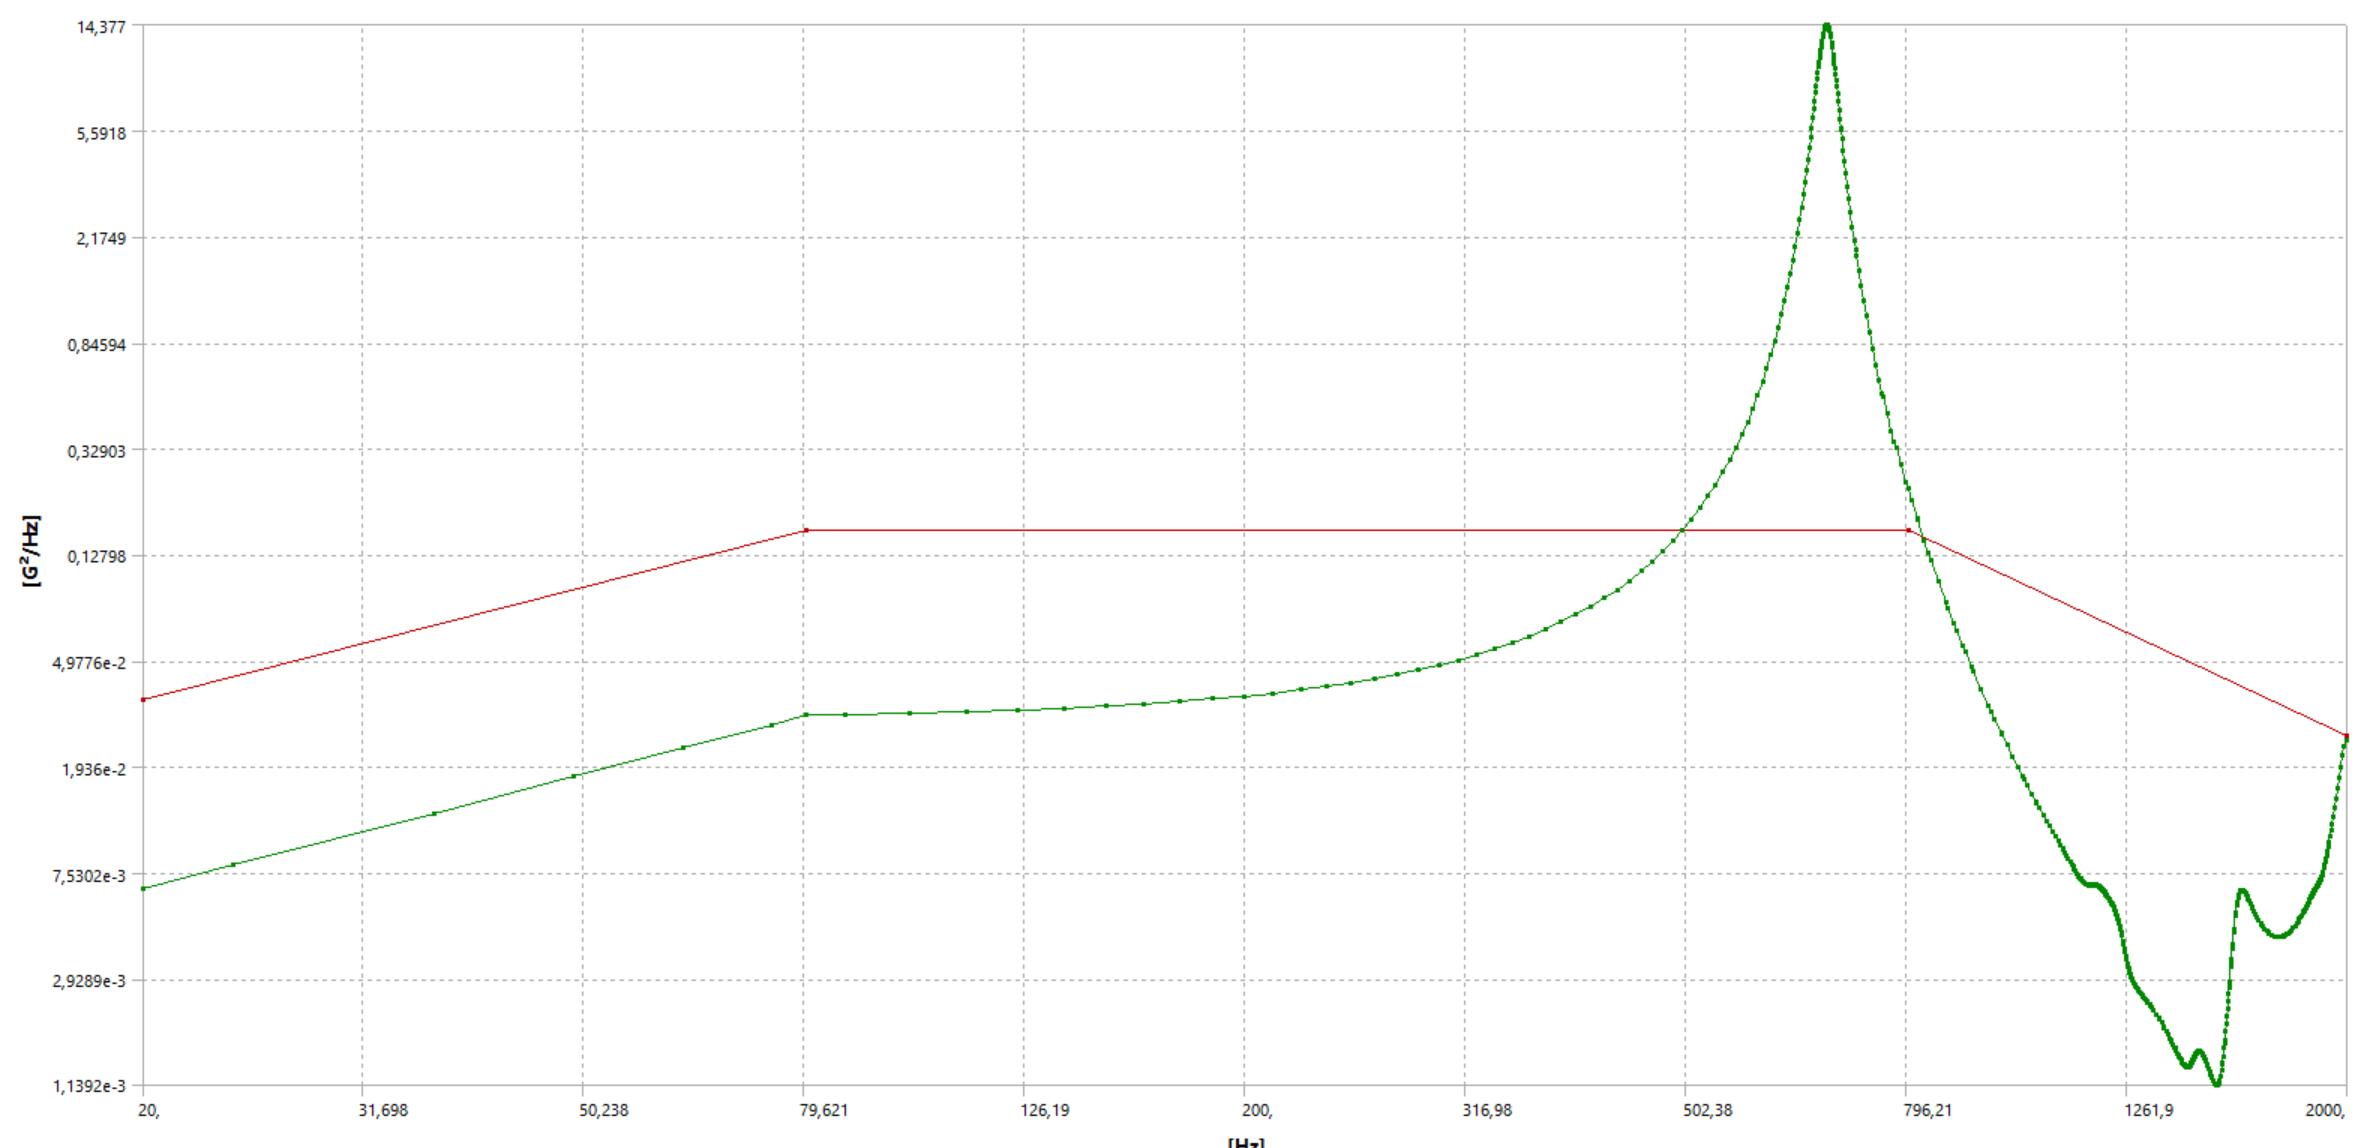
SubscriberI am trying to complete Random Vibration analysis of an assembly. The model contains a mixture of fixed and frictionless supports, as well as a number of displacement conditions. I have applied an input PSD (G acceleration) and probed the response at a predetermined location, giving the chart below.
What I'm unable to work out is why the response PSD is lower than the input, where usually these plots mirror each other up until close to the first eigenfrequency. I have probed the PSD response at the location of excitation to check whether the input PSD was applied correctly, which appeared correct.
What could be the cause of this apparent offset?
I run these analyses fairly regularly but I haven't seen this issue before so I'm hoping someone can enlighten me.
-
November 16, 2023 at 11:33 am
Ashish Khemka
Forum ModeratorHi Matthew,
Do you have damping defined in the system? Did you get correct match for same setup earlier?
Regards,
Ashish Khemka
-
November 20, 2023 at 11:25 am
Matthew Kirby
SubscriberHi Ashish,
Thanks for your reply.
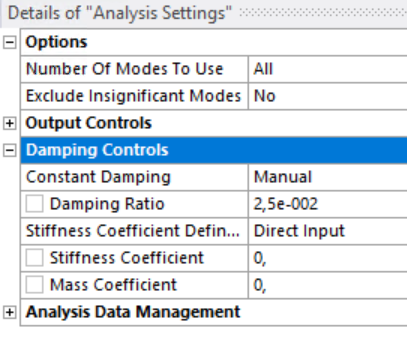
Damping ratio is defined as 0.025 across the whole frequency spectrum. And no, all previous attempts at this analysis have run into the same problem with the offset between PSD input and reponse.
We regularly run analyses with this damping ratio but have not seen this issue before.Regards,
Matt
-
November 20, 2023 at 5:08 pm
Ashish Khemka
Forum ModeratorHi Matthew,
Please wait for other forum members to comment.
Regards,
Ashish Khemka
-
December 10, 2023 at 12:57 am
GYANENDRA SASMAL
SubscriberI am having the identical issue. With or without damping factor, I get lot lower response in low frequency zone < 100 Hz. My first mode is at 218 Hz. Other parts of the assembly behave well but just one component is giving me this headache. Did you find any solutions to this? I am using ANSYS 2022R2. Newer version also gives me the same results. Thanks. Gyan
-
December 11, 2023 at 4:56 pm
dlooman
Ansys EmployeeIs it possible you requested the Response PSD to be "Relative to base motion"? Is the response psd perfectly parallel to the input psd at low frequencies? If so, what is the difference and the ratio of the two lines?
-
December 11, 2023 at 5:12 pm
GYANENDRA SASMAL
SubscriberNo, I am plotting absolute response value including base motion (not relative to the base motion). Response psd should roughly fall right on the top of input psd at low frequency.
-
December 13, 2023 at 4:40 pm
dlooman
Ansys EmployeeThe most predictable type of model is a cantilever beam. In your case, is it possible the model can't displace freely in response to the excitation, possibly due to those sliding supports. We compute participation factors based on a static analysis to compute the shape produced by a unit displacement at the excitation location. If that doesn't produce a unit translation of the entire model (like in the cantilever case) the response might be less predictable. I sometimes look at load step 2 of the psd analysis in the APDL gui to evaluate the static shape. If you have the ability to create a service request it would be good for tech. support to check this out.
-
- The topic ‘PSD Reponse lower than input PSD’ is closed to new replies.


-
4673
-
1565
-
1386
-
1231
-
1021

© 2025 Copyright ANSYS, Inc. All rights reserved.


