
TAGGED: curve-fit, hyperelastic
-
-
May 19, 2021 at 11:07 am
tiwari15abhinav
SubscriberHello Everyone.
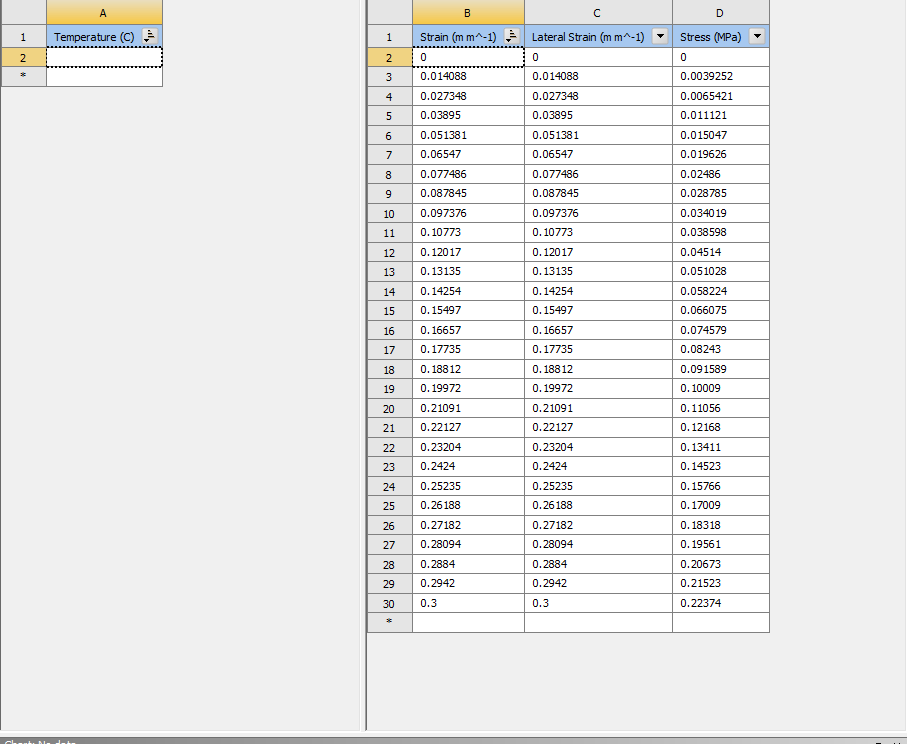
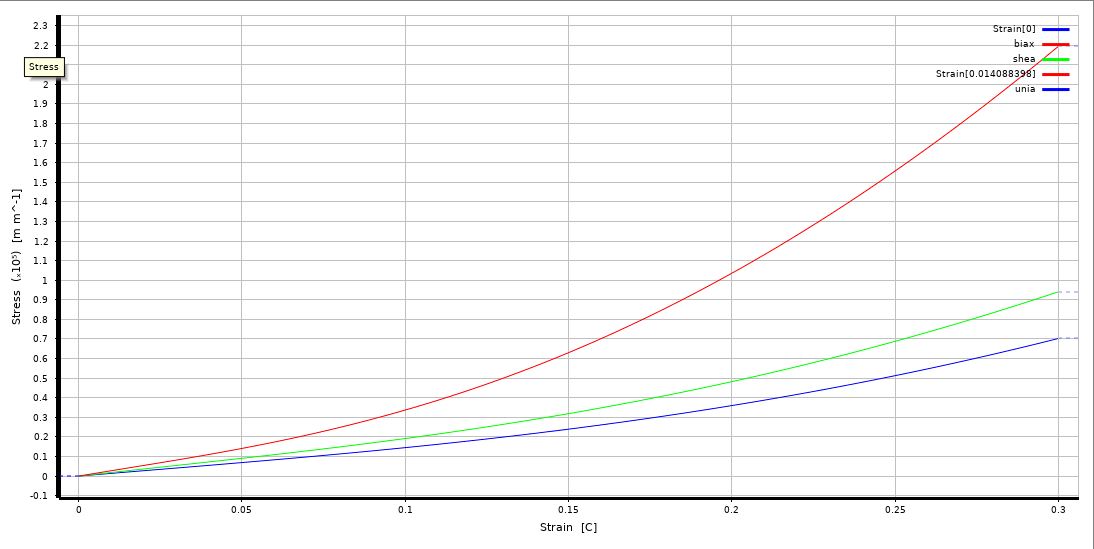
I was doing a simulation on hyperelastic material by curve fitting. I only have biaxial test data. Here, I put the test data including lateral strain. Further I am curve fitting it to find the respective constants for the material model. The problem is that when I see the curve as shown in figure below. The curve is plotted for stress (m m^-1) and strain (C). The units are wrong. Can anyone help me what it is trying to represent or is there something wrong with my setup?
Thanks in Advance
May 20, 2021 at 3:48 am1shan
Ansys EmployeeIt looks like you have added your strain values in the temperature column (hence Celsius) and stress in the strain column (hence m m -1). Leave the temperature field blank and insert just the stress strain data. This https://www.youtube.com/watch?v=K0rIwPEi0mg tutorial will help you with the curve fitting process.

Regards Ishan.
May 20, 2021 at 4:20 amSubscriber
Thanks for the quick reply.
I have put the data in their respective columns as i imported .csv file. I took care that all stress and strains values are correctly marked with correct units as shown in the figure below.
 I am still getting the curve as shown below.
Regards Abhinav Tiwari
May 23, 2021 at 10:58 pmSandeep Medikonda
Ansys EmployeeA few recommendations.
Use the latest version of Ansys Mechanical. As of the day of writing this post that is v2021R1.
Use projected units and reset your settings if needed i.e., go to Workbench and try 'Reset Workspace' and 'Reset Window Layout', then re-start WB and see if this fixes it?
If that doesn't work as well and if you are using Windows, close WB, open up file explorer and reset your appdata:
%appdata%\ansys
and rename the folder of the version you are using, i.e., v211 to v211.old if using v2021R1. Reopen your model and see if it fixes your issue.
May 25, 2021 at 7:18 amSubscriberThank you for your quick response.
I have tried all the mentioned points as you told but none of them helped.
Further I figured out that when I use biaxial test data with "Has lateral strain" option set to no the graph becomes correct as shown below
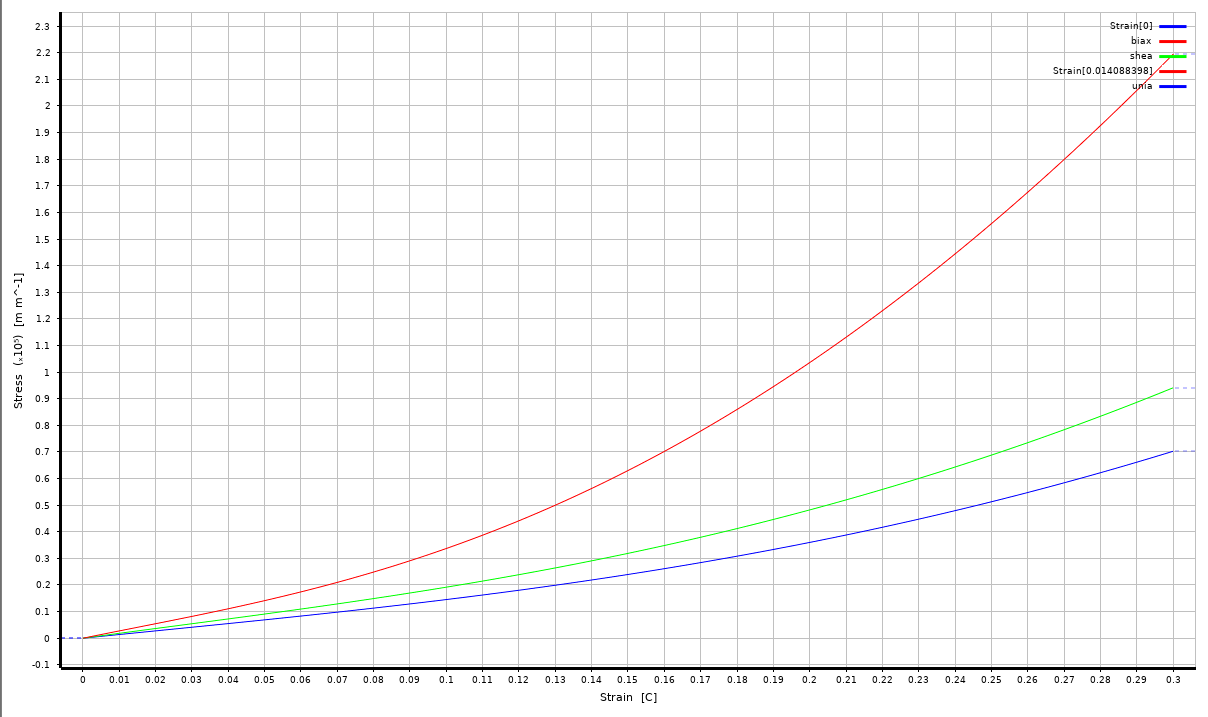
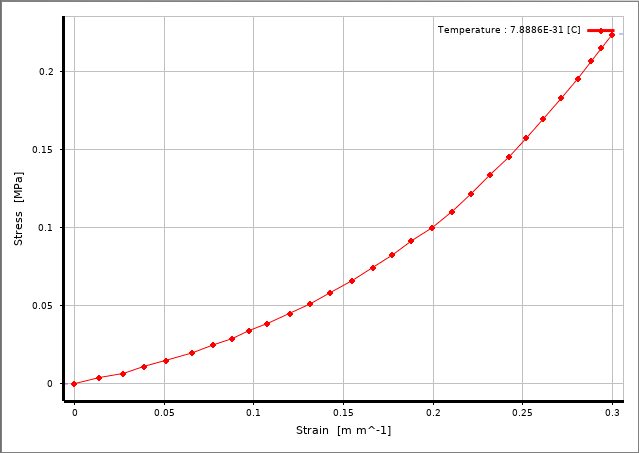 But when I use Biaxial test data with lateral strain the as shown in above post the units of the axis are wrong. Can you please tell me why I am getting the wrong graph with biaxial test data with lateral strain. I have also attached the archive file for the reference.
Regards Abhinav Tiwari
Viewing 4 reply threads- The topic ‘Problem with stress Strain Curve’ is closed to new replies.
Ansys Innovation Space Trending discussions
- The legend values are not changing.
- LPBF Simulation of dissimilar materials in ANSYS mechanical (Thermal Transient)
- Convergence error in modal analysis
- APDL, memory, solid
- How to model a bimodular material in Mechanical
- Meaning of the error
- Simulate a fan on the end of shaft
- Nonlinear load cases combinations
- Real Life Example of a non-symmetric eigenvalue problem
- How can the results of Pressures and Motions for all elements be obtained?
Top Contributors
-
peteroznewman
 3882
3882 -
scabo
 1414
1414 -
Dennis Chen
 1241
1241 -
javat33489
 1118
1118 -
Shyam Prasad V Atri
1015
Top Rated Tags
© 2025 Copyright ANSYS, Inc. All rights reserved.
Ansys does not support the usage of unauthorized Ansys software. Please visit www.ansys.com to obtain an official distribution.
-


The Ansys Learning Forum is a public forum. You are prohibited from providing (i) information that is confidential to You, your employer, or any third party, (ii) Personal Data or individually identifiable health information, (iii) any information that is U.S. Government Classified, Controlled Unclassified Information, International Traffic in Arms Regulators (ITAR) or Export Administration Regulators (EAR) controlled or otherwise have been determined by the United States Government or by a foreign government to require protection against unauthorized disclosure for reasons of national security, or (iv) topics or information restricted by the People's Republic of China data protection and privacy laws.


