TAGGED: unsteady-simulation, unsteady-tracking
-
-
December 22, 2024 at 4:11 am
se23mcme001
SubscriberHi folks,
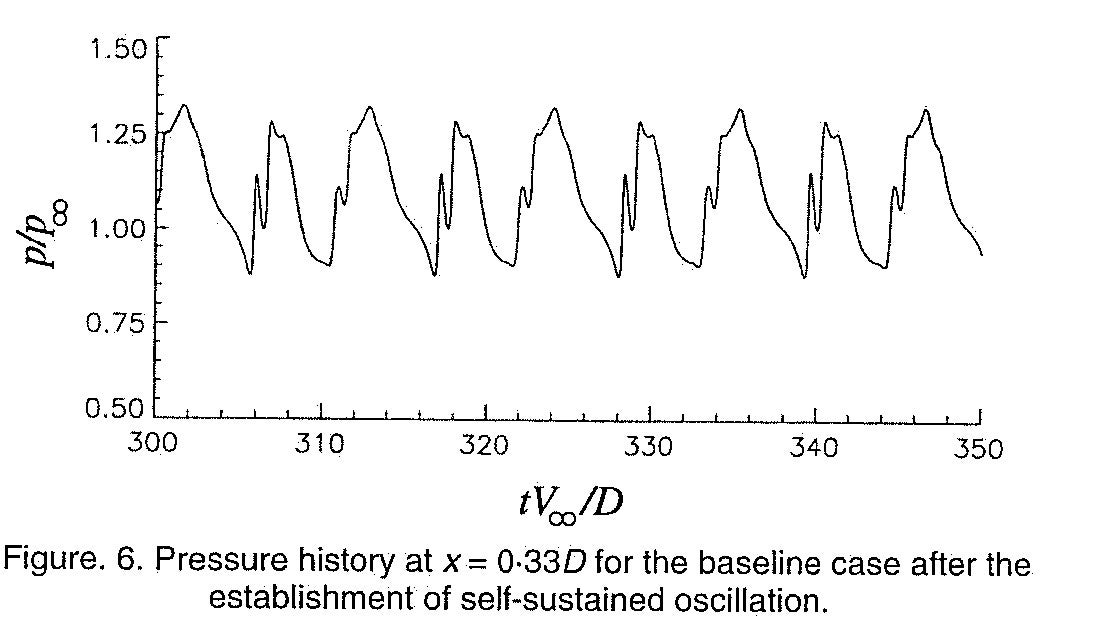
I am currently working on a supersonic cavity problem. I want to plot p/p_infinity vs. t*V_infinity/D in Fluent for validating my baseline paper.
I have values of p_infinity = 101325 Pa; V_infinity & D with me.
I need help with plotting with these two parameters together.
-
December 23, 2024 at 1:27 pm
Rob
Forum ModeratorPlotting the above can be done in Fluent but we'd usually plot a variable againt position using xy plots. You may be better off plotting each variable against position and doing the final plot in Excel or the like.
-
December 23, 2024 at 1:28 pm
se23mcme001
SubscriberI will try... thanks.
-
December 23, 2024 at 1:39 pm
Rob
Forum ModeratorIf that's time, you can monitor "something" over time and do much the same. I find it's generally easier to manipulate data outside of Fluent, simply as I can more easily change units, and add constants to data.
-
December 23, 2024 at 2:26 pm
se23mcme001
SubscriberYes, that's time only... it should be flow time only, right? remaining two are constants
-
December 23, 2024 at 2:35 pm
Rob
Forum ModeratorYes, flow time only from Fluent. Monitor pressure(?) against time & then into Excel.
-
December 23, 2024 at 2:36 pm
se23mcme001
Subscriberthanks, i will try and update
-
- You must be logged in to reply to this topic.


-
4678
-
1565
-
1386
-
1242
-
1021

© 2025 Copyright ANSYS, Inc. All rights reserved.


