-
-
May 24, 2023 at 4:28 pm
Aye Sandar Kyaw
SubscriberHello everyone!
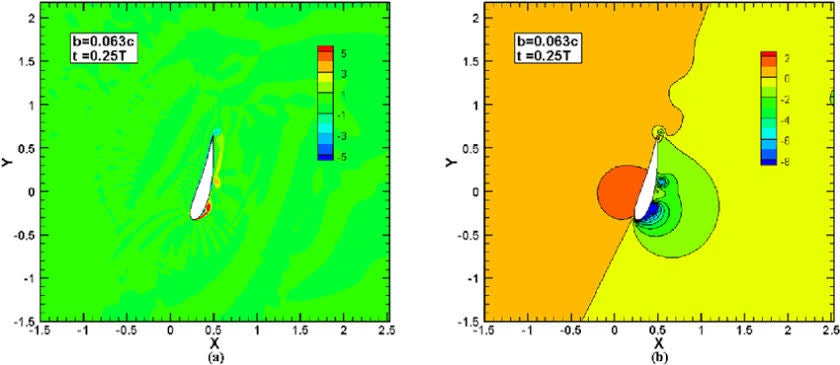
I am having difficulty how to plot the graph like the following figure.
Currently, I run single-phase non-cavitating flow under different mainstream velocities. I want to express my results to be clear about how pressure changes.
Do I need to use specific software to get the figures like this?
Moreover, I don't want to plot the whole domain. I just want to plot the flow around the hydrofoil. Please provide me with how I can export the data for the selected region.
I tried to find it, but I was so confused because I am not familiar at all.
Thanks in advance!
Â
Â
-
May 24, 2023 at 10:54 pm
Rahul Kumar
Ansys EmployeeHello,Â
You should be able to plot this in Fluent, EnSight and CFD Post. EnSight has more flexibility in terms of creating subparts (in case you don't have a split domain in Fluent to plot the contours) and then plotting contours. EnSight can take Fluent files or you can also export solution data in .encas format. Please see user's guide for more information.Â
-
May 25, 2023 at 12:35 am
Aye Sandar Kyaw
SubscriberHello,Â
Thank you so much for your comment.Â
I will try to do.
-
- The topic ‘Pressure Contour lines graph’ is closed to new replies.
- air flow in and out of computer case
- Varying Bond model parameters to mimic soil particle cohesion/stiction
- Eroded Mass due to Erosion of Soil Particles by Fluids
- I am doing a corona simulation. But particles are not spreading.
- Guidance needed for Conjugate Heat Transfer Analysis for a 3s3p Li-ion Battery
- Centrifugal Fan Analysis for Determination of Characteristic Curve
- Issue to compile a UDF in ANSYS Fluent
- JACOBI Convergence Issue in ANSYS AQWA
- affinity not set
- Resuming SAG Mill Simulation with New Particle Batch in Rocky
-
3882
-
1414
-
1241
-
1118
-
1015
© 2025 Copyright ANSYS, Inc. All rights reserved.