-
-
July 22, 2025 at 7:04 pm
kashfia.mahmood
SubscriberHello,
I am running a coupled field analysis with a) coupled field static, which is the prestress for both b) coupled field modal and c) coupled field harmonic. I am simulating an ultrasonic transducer.
In both the ANSYS Mechancial Wirebonder example (39) and my own simulation, I'm finding that the lower frequency ranges (~20-30 kHz range) show a mode at the antiresonance (peak impedance) rather than resonance (minimum impedance). Since the resonance is usually characterized as the 'natural frequency', I would expect the mode to be at the resonance instead of the antiresonance.
I have included photos of my simulation. Below is my prestressed coupled field harmonic impedance response:, with resonance at ~28000 kHz and antiresonance at ~28800 kHz.
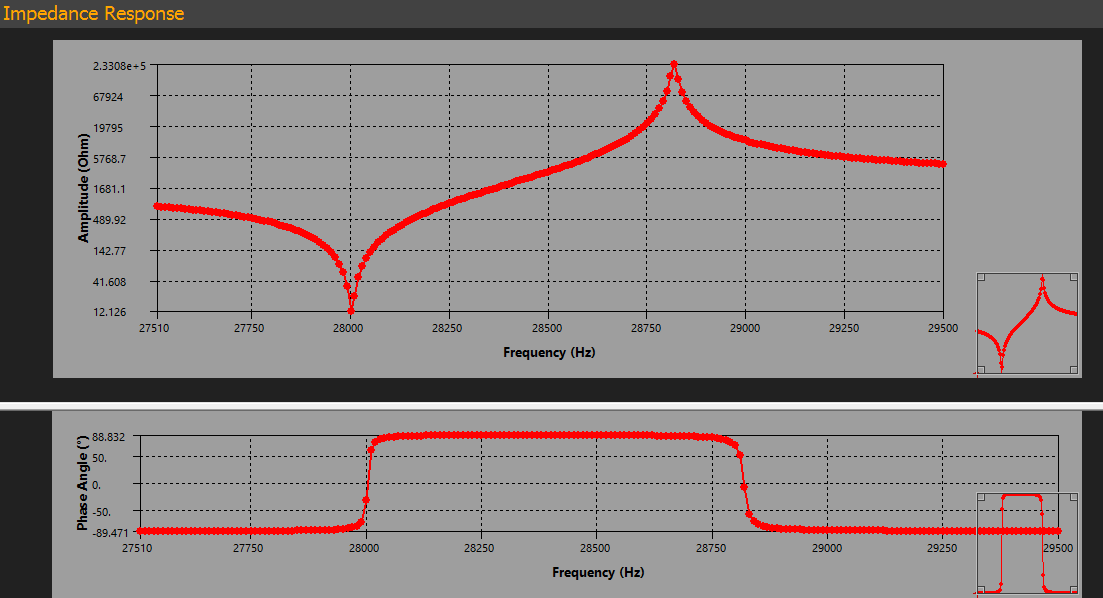
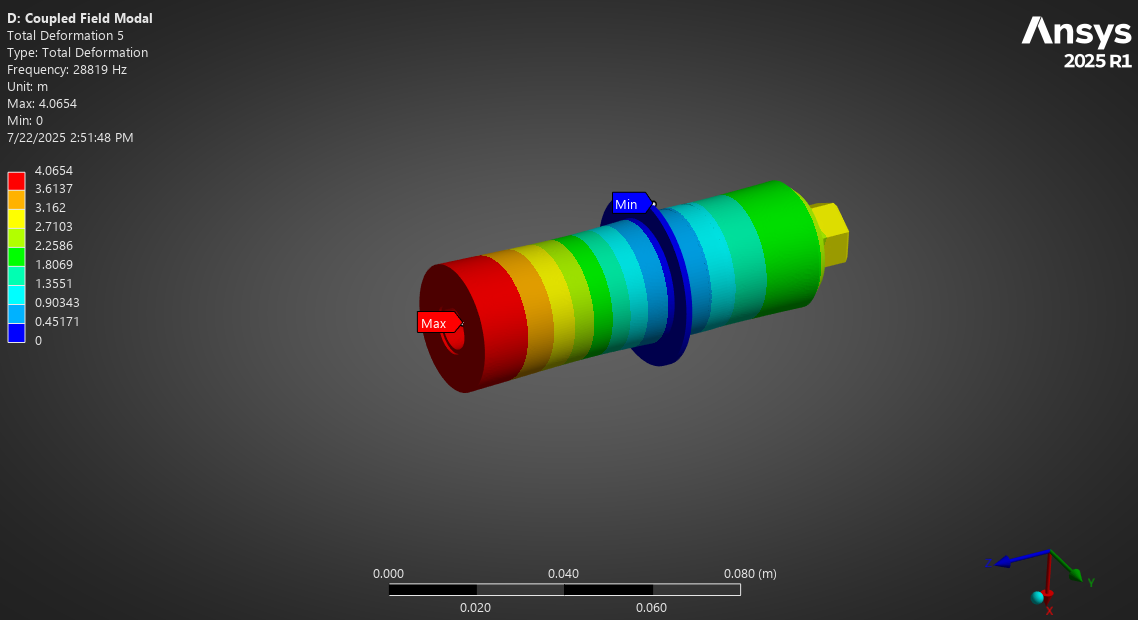
And my prestressed coupled field modal response, showing the longitudinal mode of interest at ~28800 kHz.
I initially thought it was a setup issue, but it seems the wirebonder example has the same properties for the first longitudinal resonance around 26.8 kHz.
Why is the coupled field modal analysis showing a longitudinal mode at the antiresonance instead of the resonance? If I add an ultrasonic horn to the transducer, should it be operating at the antiresonance (28800 kHz) or resonant (28000 kHz) frequency, since the modal response for the transducer shows 28800 kHz?
Any help would be greatly appreciated! Let me know if I can provide any other details.
-
July 23, 2025 at 3:48 pm
dlooman
Ansys EmployeeDoes APDL Verification Manual Test Case VM176 shed any light on this question?
-
July 23, 2025 at 4:06 pm
kashfia.mahmood
SubscriberI'm using ANSYS Mechanical, so my understanding of APDL isn't great. I'm not too sure how to interpret VM176; I also looked through VM175.
Does the example mean that the modal results show the lowest admittance/highest impedance (from VM175, the 'open-circuit' point, aka antiresonance)?
-
July 23, 2025 at 5:15 pm
dlooman
Ansys EmployeePiezolectricity provides a stiffening effect so the higher frequency would be the resonant frequency to use for excitation. The graph you provided looks like the Impedance graph, even though you have labeled the axis Admittance (Ohm).
-
July 23, 2025 at 6:00 pm
kashfia.mahmood
SubscriberHi, thank you for the help.Â
To clarify, I am trying to model the ultrasonic transducer in series resonance. The graph is labelled Amplitude (Ohm), as I am looking at the impedance measurements rather than the admittance measurements. Currently, the impedance plot from the coupled field harmonic analysis matches the frequency sweep of the transducer we have perfectly. My concern is with the outputs of the coupled field modal analysis as it shows the parallel resonance/series antiresonance, which has the same prestress as the coupled field harmonic analysis.Â
I'm planning to drive the transducer at series resonance (28000 kHz) rather than antiresonance (the higher frequency, 28800 kHz). I am looking for clarification as to why the resonance frequency in the harmonic analysis (the frequency with lowest impedance and the highest z-deformation) is not the same as the frequency that the coupled field modal analysis provides for the same longitudinal movement. I am not sure if I messed up a setup step somewhere, or if the series modelling uses a different method, but any direction would be greatly appreciated!
Â
-
- You must be logged in to reply to this topic.
-
3572
-
1118
-
1063
-
1050
-
952
© 2025 Copyright ANSYS, Inc. All rights reserved.