-
-
July 25, 2023 at 8:17 am
Ha heongyu
SubscriberHi there.
I am student mainly using LS-DYNA and Ansys mechincal.
I am doing stamping forming simulation and I have some question.
I like to visualize the model applying graph(Forming Limit Diagram) to every single mesh.
For example, in paper "Springback Prediction in Sheet Metal Forming, Based on Finite Element Analysis and Artificial Neural Network Approach"
Author did Stamping Forming simulation and Applied FLD to Model Like image.
I think the Author first located every single mesh to left graph and gave color.
I want to know how to do this.
User defined Results? Python codes?
I will very appreciate if you let me know.
Thank you. -
July 26, 2023 at 11:57 am
Ram Gopisetti
Ansys Employee-
July 27, 2023 at 3:07 am
Ha heongyu
SubscriberThank you So much!
I found the fld menu and opened the Plotwindow-1 window, But I failed to display point in graph and display color at model.
I will very appreciate if you let me know how to do that.
-
July 27, 2023 at 7:02 am
Ha heongyu
SubscriberThank you for answering.
It wasn't that i didn't find the way to point the mesh in fld plot, but my fld values were strange.
Any mesh i choose, the values like t, %R, E1, E2, EPS, Beta is all zero.
It's same to each mesh all.
So i guess all mesh were pointed in origin in fld plot.
Is this because I designed the punch, plate, die as a shell surface model?
Why is this like this??
I will very appreciate if you help me little more.
-
-
- The topic ‘
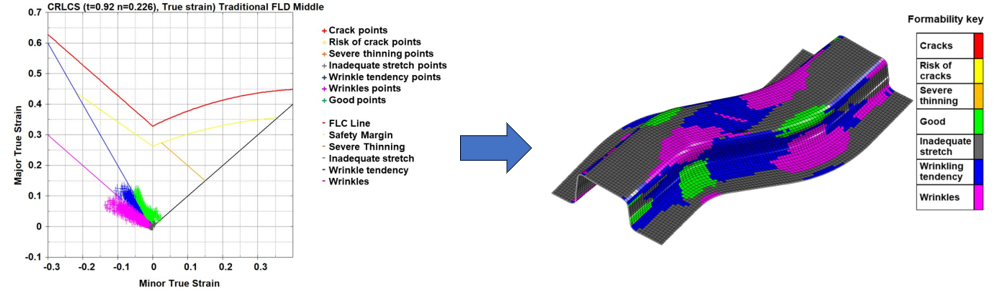
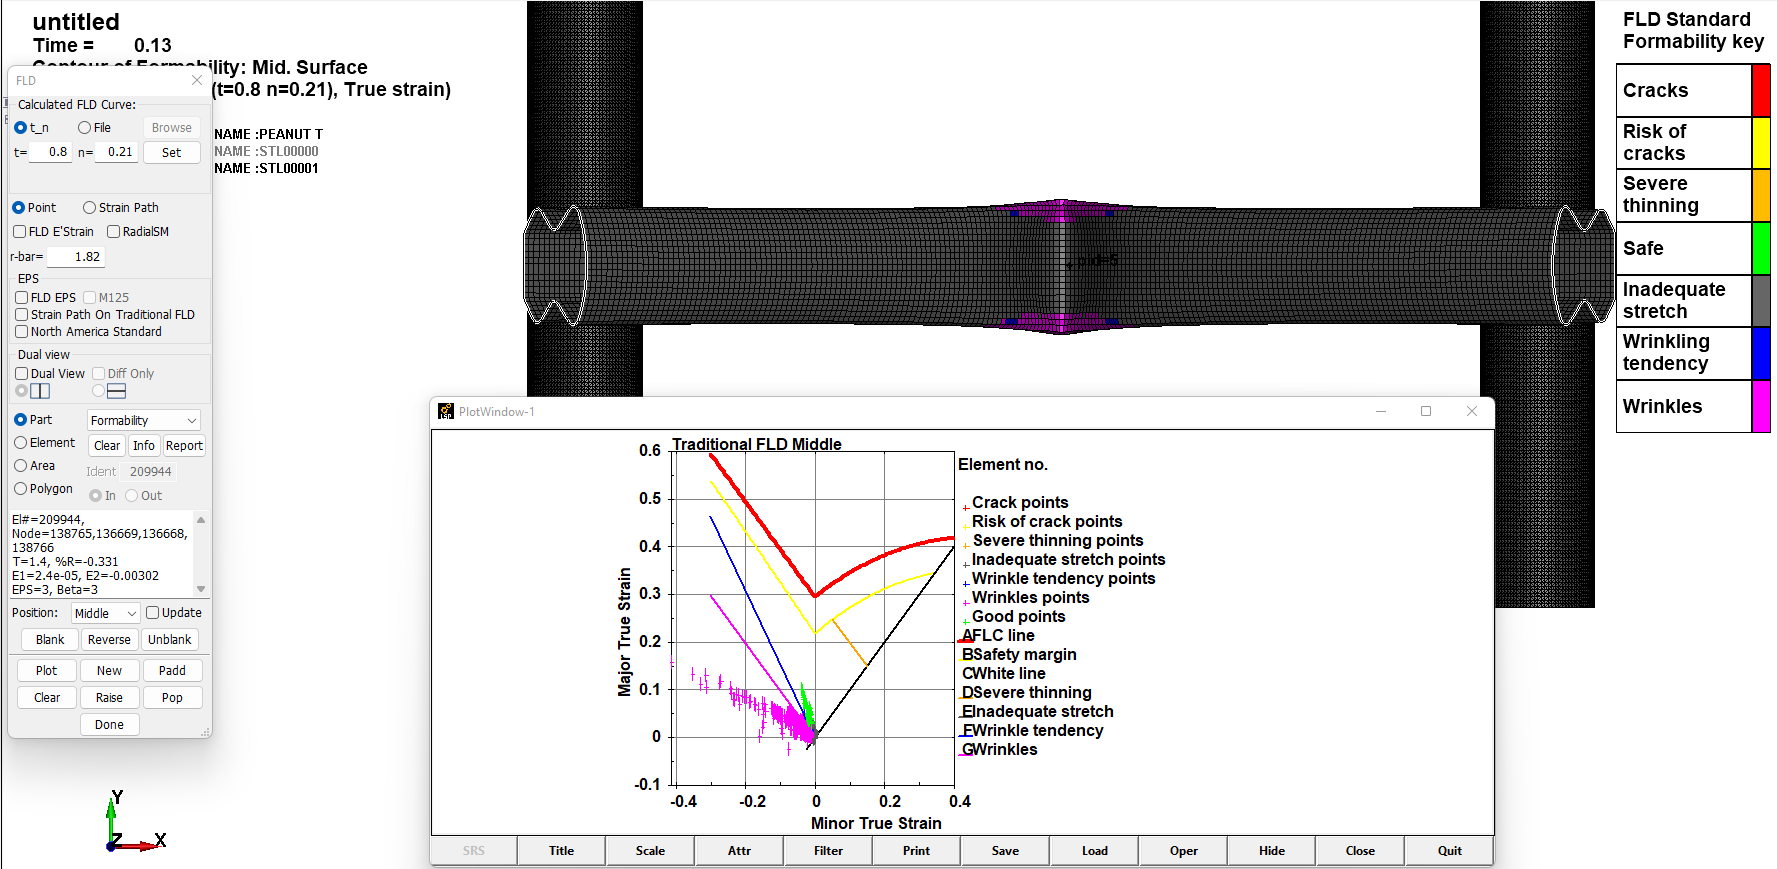
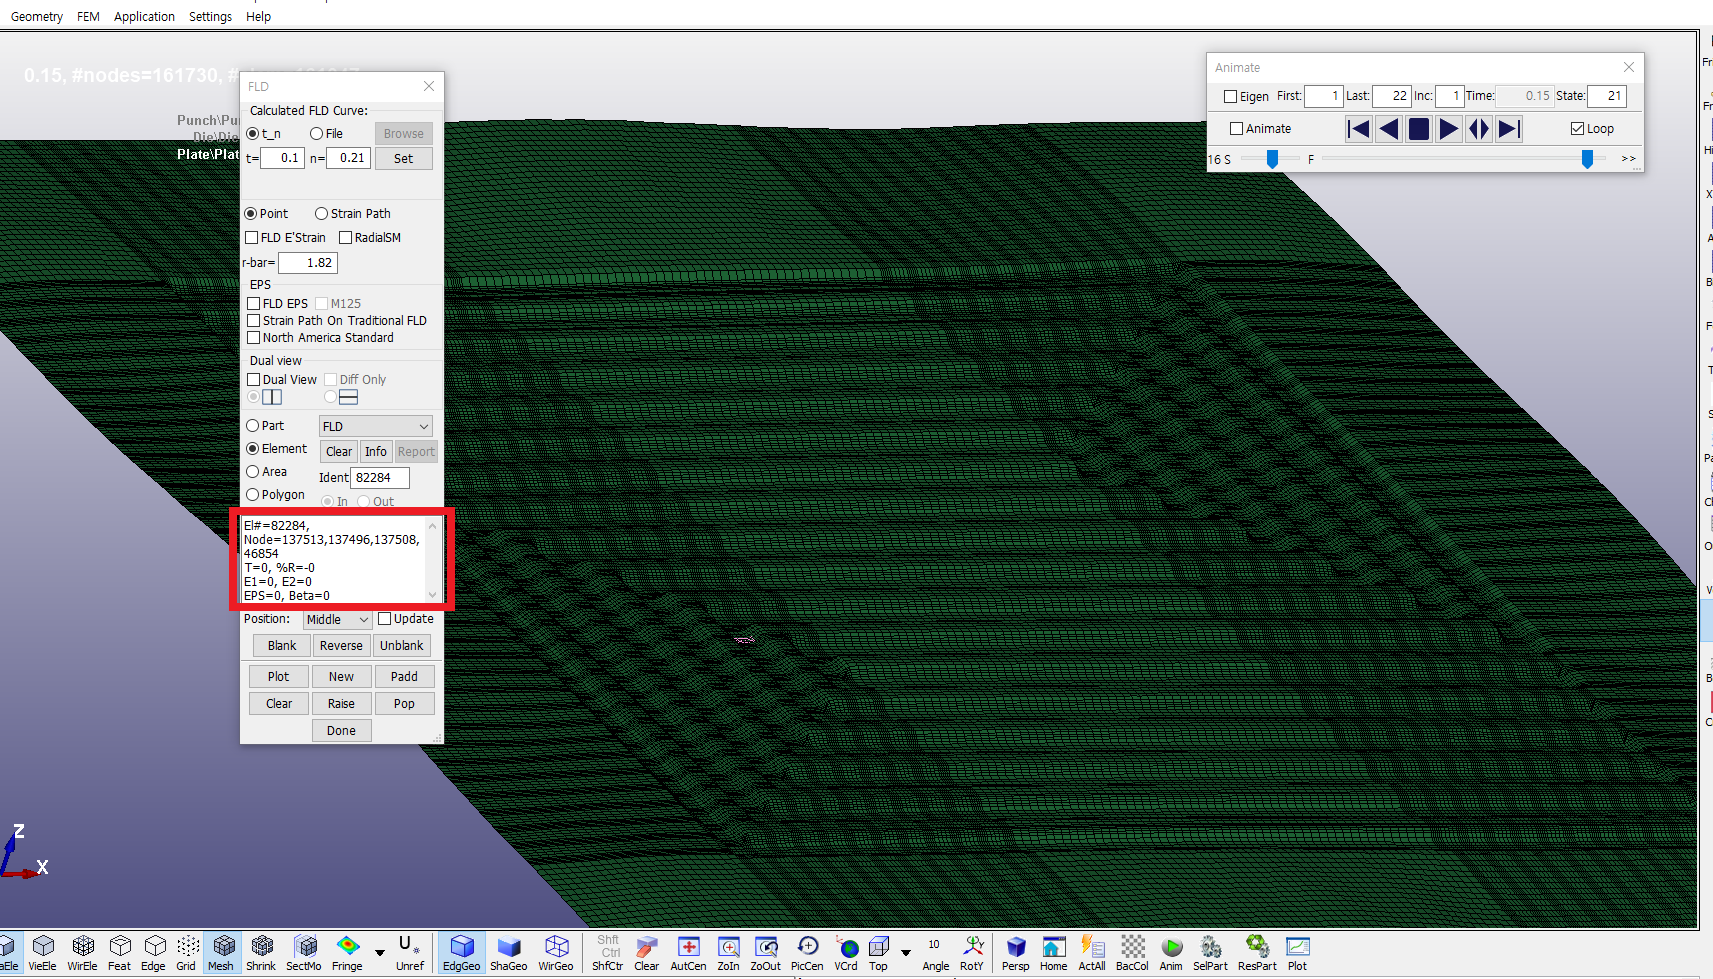
Post Processing and Visualizing Result As I want’ is closed to new replies.
-
3492
-
1057
-
1051
-
965
-
942
© 2025 Copyright ANSYS, Inc. All rights reserved.