TAGGED: antenna-design, plotting-results
-
-
December 12, 2023 at 12:07 pm
Luca Rossi
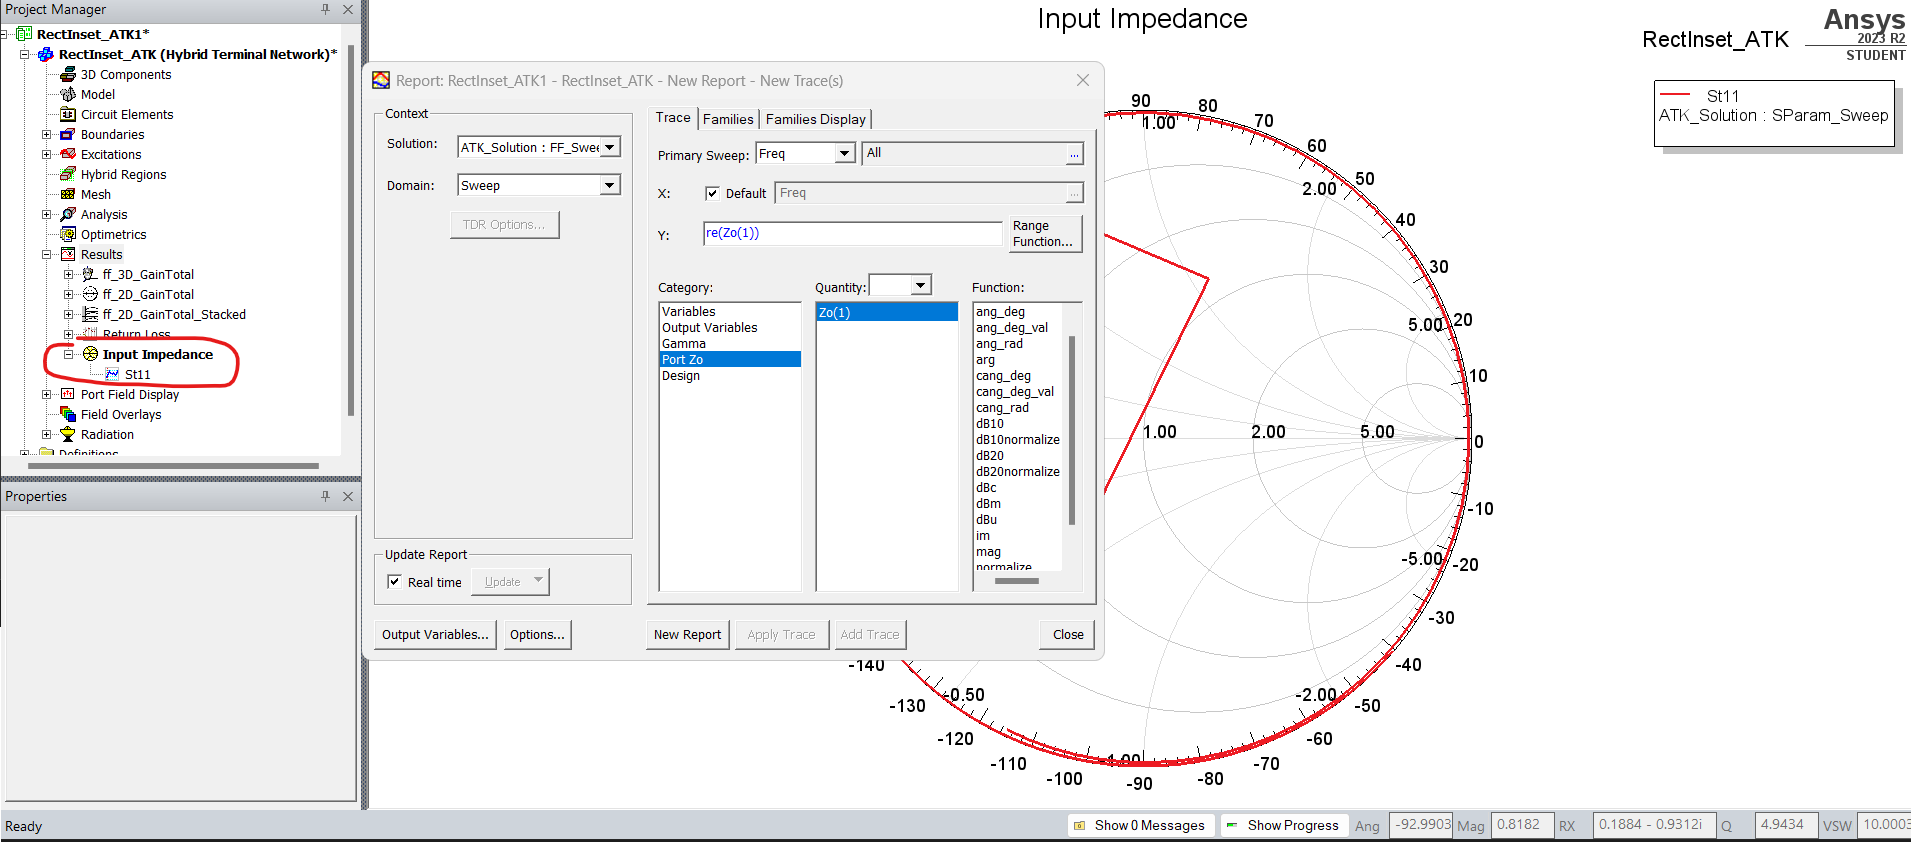
SubscriberI have just started very recently on Ansys Electronics and am watching several tutorial videos on youtube.I would like to plot the real and imaginary part of the impedance (Z-Parameters), i.e. Z1,1 real and image but I don't understand how to do it.I clicked on "Results" - "Create Modols Solution Data Report" - "Rectangular Plot" but in "Category" I can't find Z-parameter -
December 12, 2023 at 3:49 pm
AncS
Ansys EmployeeHello Luca,
To plot the real and imaginary part of the Z-Parameters i.e. Z(1,1), please go through- Results > Create Terminal Solution Data Report > Rectangular Plot. Here you will find the Terminal Z parameter. Select the 're' and 'im' from the 'Function' category and plot the desired results.
Best regards
Anchal
-
Viewing 1 reply thread
- The topic ‘Plot Z-Parameter results’ is closed to new replies.
Innovation Space


Trending discussions


Top Contributors


-
4703
-
1565
-
1386
-
1242
-
1021
Top Rated Tags


© 2025 Copyright ANSYS, Inc. All rights reserved.
Ansys does not support the usage of unauthorized Ansys software. Please visit www.ansys.com to obtain an official distribution.


