-
-
November 6, 2018 at 6:33 pm
abd fs
SubscriberHi to all,
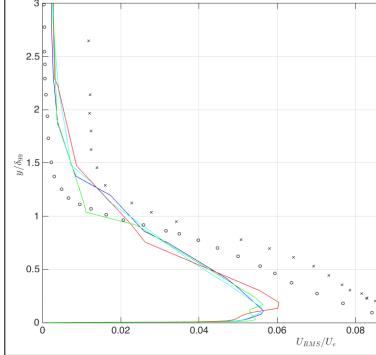
As it is known that the root mean square of the turbulent velocity fluctuation can be calculated in RANS as follows (with the turbulent kinetic energy k is known );
u'=(2k/3)^0.5
I am doing simulation in Fluent using one equation RANS and i want to plot the rms of turbulent velocity for this RANS model.
I tried to plot, but I got a wrong curve
How can I plot the rms of turbulent velocity in RANS?
Thank you.
EDIT - moving to Fluids. Please post in the correct topics.
-
November 7, 2018 at 12:10 pm
Amine Ben Hadj Ali
Ansys EmployeeWhy do you think it is wrong? That is the only way to get root mean square in Boussinesq apporach based turbulence models.
-
November 7, 2018 at 1:35 pm
-
November 7, 2018 at 1:40 pm
Amine Ben Hadj Ali
Ansys EmployeeThat is what we call validation: so the plot is correct but you are underestimating the fluctuation.
-
November 7, 2018 at 1:45 pm
abd fs
SubscriberThank you for sharing these information here.
In your opinion how can I fix this problem?
Best regards?
SERRARE
-
November 7, 2018 at 2:55 pm
Rob
Forum ModeratorHow much mesh have you got in the near wall region?
-
November 7, 2018 at 3:13 pm
-
November 7, 2018 at 3:52 pm
Amine Ben Hadj Ali
Ansys Employee1/Use Low-Reynolds mesh with yplus 1 to 5 and at least 15 cells in boundary layers
2/Make a grid sensitivity analysis and work with high order schemes
3/Comapre with other RANS turbulence models (SST, Realizable with EWT or Menter Lechner) and especially the one which might account for anisotropy: RSM
3/Are you plotting the value directly after the expansion region / step (weak recirculation zone)
4/Judge your results describe them and document them
there is no bad correct or wrong results: only bad or good comments on results.
-
November 7, 2018 at 4:51 pm
abd fs
SubscriberOk, I will try this and post here the results
Best regards,
SERRARE
-
November 7, 2018 at 5:47 pm
-
November 8, 2018 at 12:34 pm
abd fs
SubscriberHello Sir Amine,
(1/Use Low-Reynolds mesh with yplus 1 to 5 and at least 15 cells in boundary layers)
I tried implementing it , but I can't do it if you can help me with pictures that carry the steps to do it.
Best regards,
SERRARE
-
November 8, 2018 at 6:54 pm
Amine Ben Hadj Ali
Ansys EmployeeJust make rough estimation for yplus and use conservative cell growth rate for the first cells near the walls. Run once. Have a look into the turbulent viscosity ratio. The Max should of will indicate approximately the middle if boundary layer. If the resolution not enough remesh and rerun...
-
November 8, 2018 at 7:41 pm
abd fs
SubscriberThank you so much Amine.
Ok, I will try this and post here the results
Best regards,
SERRARE
-
- The topic ‘plot the rms of turbulent velocity’ is closed to new replies.


- air flow in and out of computer case
- Varying Bond model parameters to mimic soil particle cohesion/stiction
- Eroded Mass due to Erosion of Soil Particles by Fluids
- Centrifugal Fan Analysis for Determination of Characteristic Curve
- Guidance needed for Conjugate Heat Transfer Analysis for a 3s3p Li-ion Battery
- I am doing a corona simulation. But particles are not spreading.
- Issue to compile a UDF in ANSYS Fluent
- JACOBI Convergence Issue in ANSYS AQWA
- affinity not set
- Resuming SAG Mill Simulation with New Particle Batch in Rocky

-
3862
-
1414
-
1220
-
1118
-
1015

© 2025 Copyright ANSYS, Inc. All rights reserved.


