-
-
April 2, 2024 at 9:15 pm
LoïcS
SubscriberHello,
I have simulated a plate moving normal to a wall. I'm now interested to get the pressure distribution on the plate at a specific time step. How can I define the time step in fluent results? Does the following plot correspond to the last time step of my simulation?
Â
Â
In addition, i'm also interested to have the fluid flow direction around the plate. How can I plot that? I have try pathlines but i'm not sure how to interpret those line without direction specify.
Â
-
April 3, 2024 at 10:16 am
Rob
Forum ModeratorThe data set is unique for a specific time (step), there isn't a history like in Mechanical. I suspect velocity vectors on the missing (symmetry?) surfaces will be a good starting point to look at the fluid flow.Â
-
April 9, 2024 at 11:20 pm
LoïcS
SubscriberHow can I know the time step of the data used to plot such distribution?
-
April 10, 2024 at 6:45 am
NickFL
SubscriberIf you do not tell Fluent to save any intermediate solutions, it will only save the last one.Â
Review the second video in the Transient Flow Modeling Fluent training course (hopefully linked below). Pay particular attention at about 4:50.
-
-
- The topic ‘
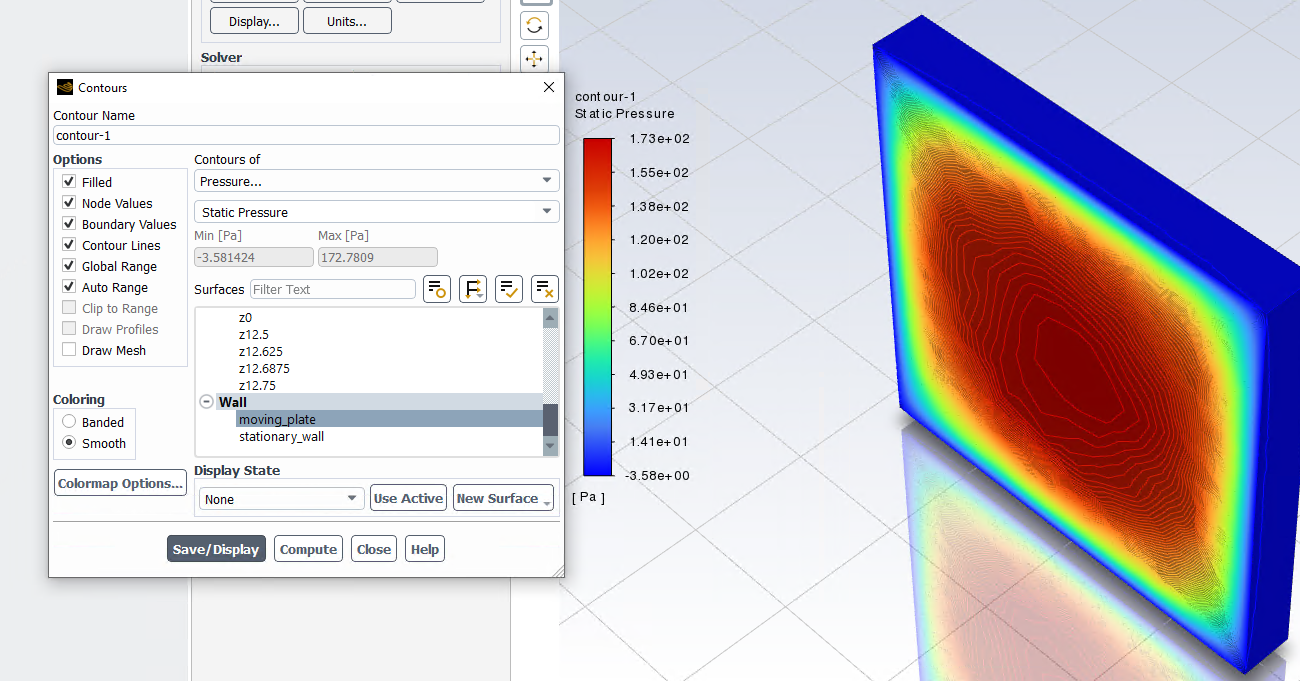
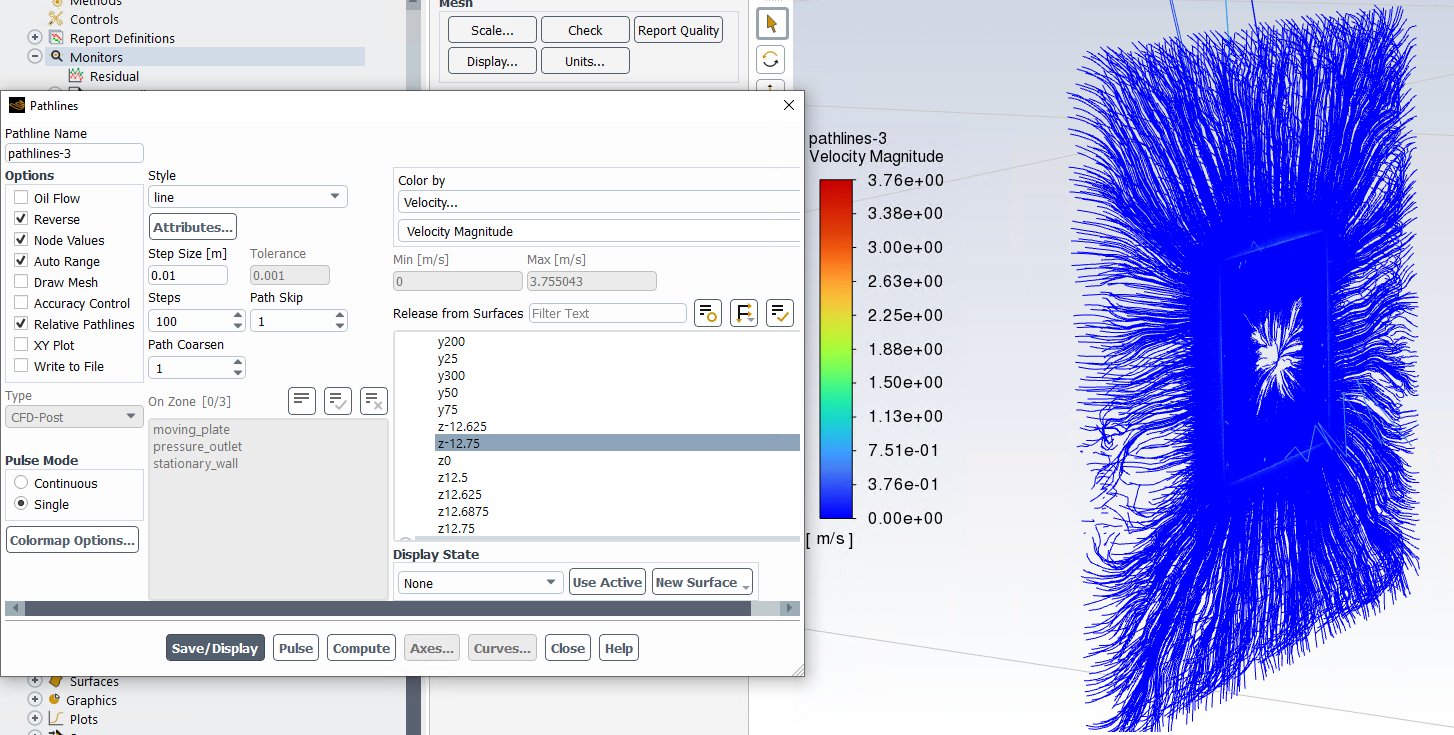
Plot pressure and fluid flow at a specific time step’ is closed to new replies.
- air flow in and out of computer case
- Varying Bond model parameters to mimic soil particle cohesion/stiction
- Eroded Mass due to Erosion of Soil Particles by Fluids
- I am doing a corona simulation. But particles are not spreading.
- Guidance needed for Conjugate Heat Transfer Analysis for a 3s3p Li-ion Battery
- Centrifugal Fan Analysis for Determination of Characteristic Curve
- Issue to compile a UDF in ANSYS Fluent
- JACOBI Convergence Issue in ANSYS AQWA
- affinity not set
- Resuming SAG Mill Simulation with New Particle Batch in Rocky
-
3882
-
1414
-
1241
-
1118
-
1015
© 2025 Copyright ANSYS, Inc. All rights reserved.