

TAGGED: #fluent-#ansys, dpm-tracking, histogram, particle-distribution
-
-
January 3, 2024 at 9:18 pm
ll00023
SubscriberI am running DPM for coal combustion.
the initial particle size follows Rosin-Rammler distribution.
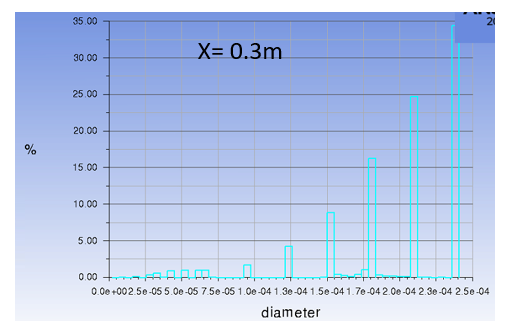
I check the particle size in downstream on a plane. it shows below.
Why the particle size shows gaps between each other?
Thank you.
-
January 4, 2024 at 11:11 am
Rob
Forum ModeratorCan you post the equivalent chart just after the injection? I'm assuming it's not burning and that all the parcels have reached the monitor plane.
-
January 4, 2024 at 3:37 pmSubscriber
This is the particle size just after they are released.

-
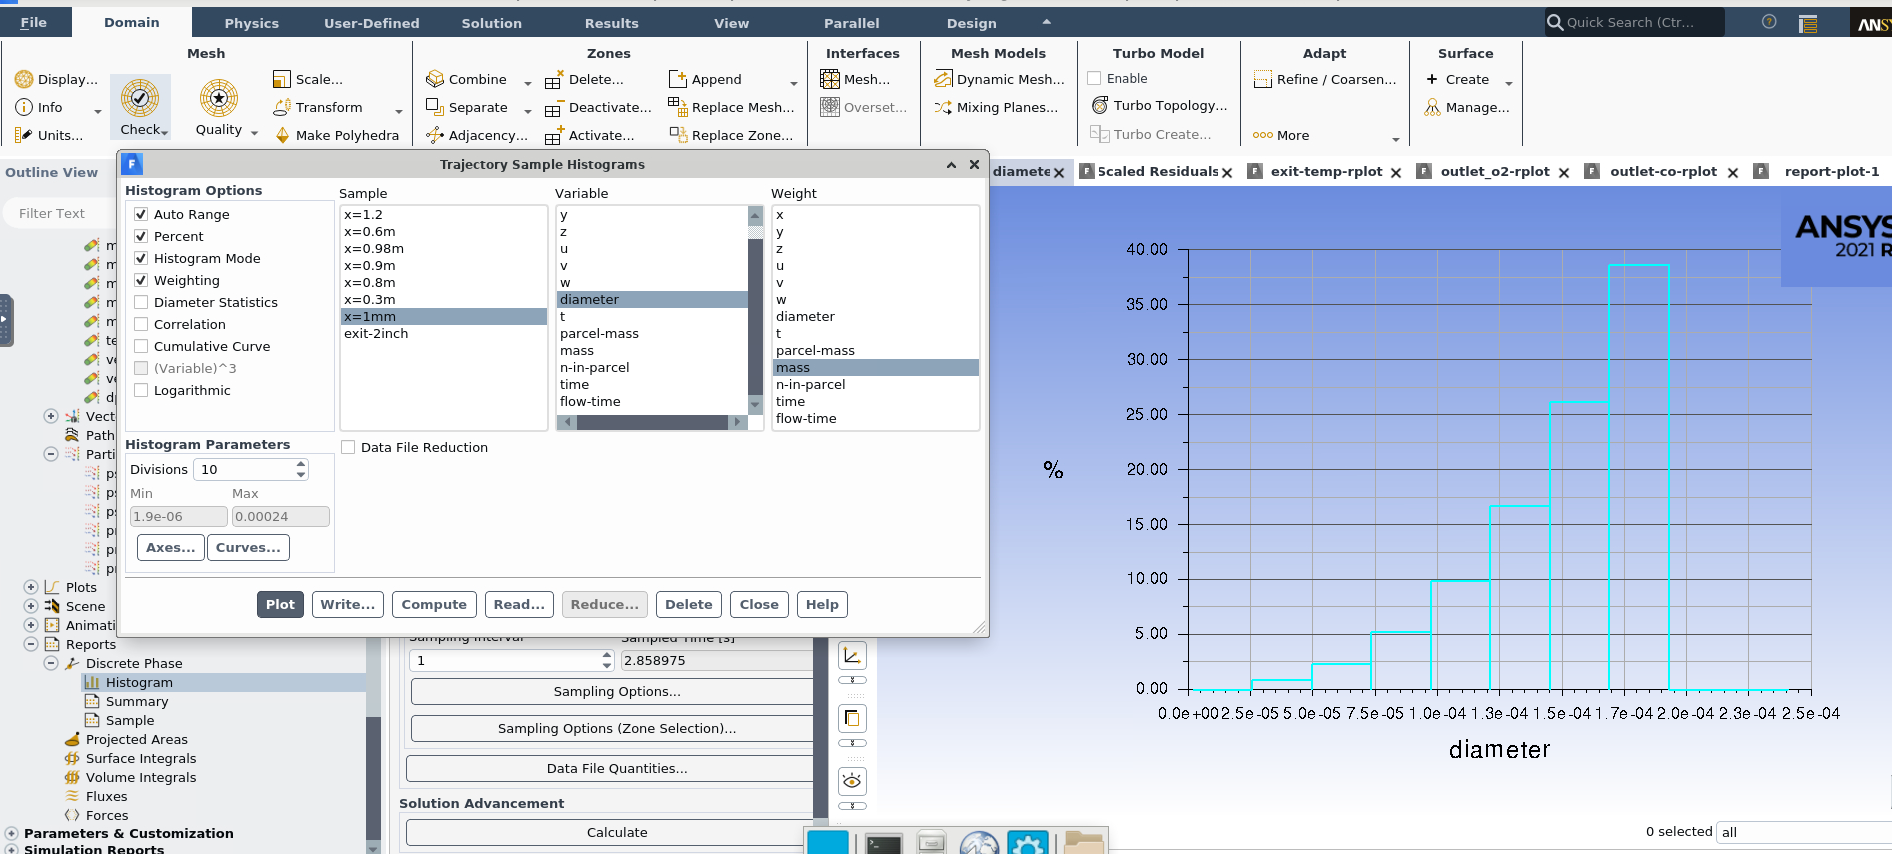
January 4, 2024 at 3:43 pmSubscriber
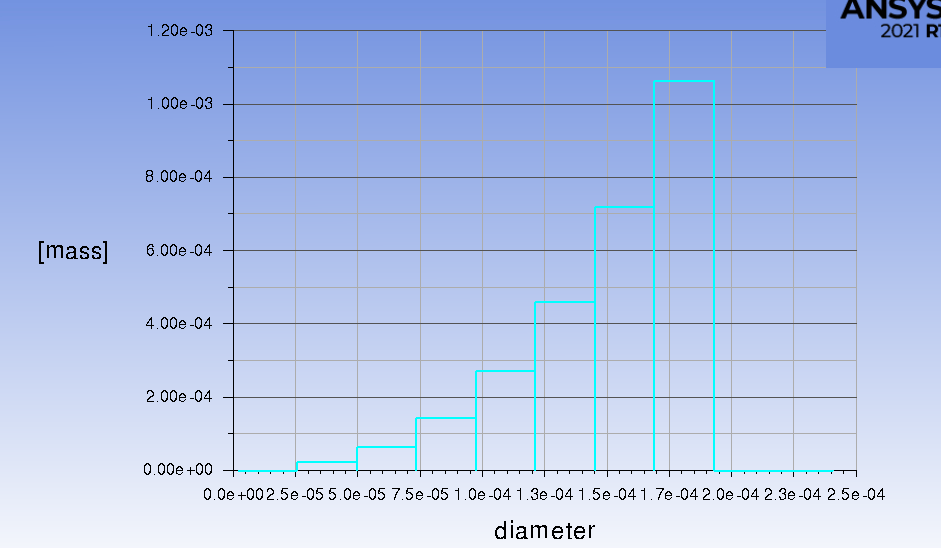
This is the figure I use mass weighing.
I set the RR distribution by 10 groups of particle. I think this is the reason.
But I don't understand the weighing meaning. how the weighing factor works?
the other question is: why the particle size on this sampling is different from the the figure of particle tracks?
from histogram, the mass of particle concentrates on about 150 micron. but base on RR distribution setting (mean diameter 65 micron,), it should be concentrating on much smaller size.
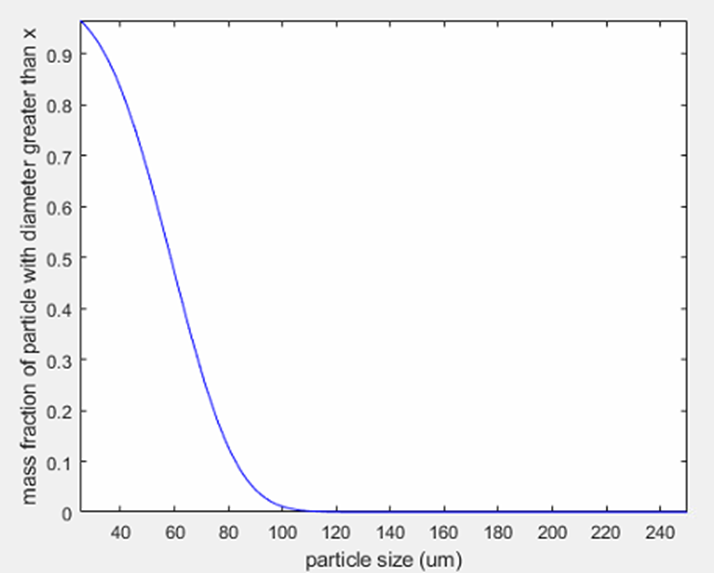
the mass fraction of particle based on sizes are posted.
Thank you.
-
January 4, 2024 at 4:06 pmForum Moderator
And what models are on? If you replot with “Percent” deselected what do you see?
Also check the RR definition in the manual is what you're expecting. I tend to use 5-10 single size injections over RR as it's also then easier to work out what particles go where. Ie if a large particle mass is seen in a report is it few big particles or many smaller ones - with RR you'll need to interrogate the DPM.out files.
-
January 26, 2024 at 8:50 pmSubscriber
It seems my boss is not happy about my previous explanation of particle mass. I need to interrogate the dpm output.
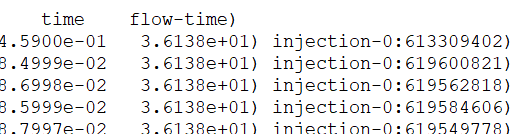
mass = particle mass * n-in-parcle
flow-time means the simulation time.
what's the time meaning here?
the particle mass flow rate will be the derivative of the mass, right?

-
-
January 6, 2024 at 1:47 pmSubscriber
I am using DPM model.
I attached the figure after deselected percent. the mass of 150 micron particle seems large. (the initial mass flow rate of coal particle is 3.9e-4kg/s). I didn't know how to explain the figure.
I have tried to use 10 particles to get the trajectory. the conclusion I got is that particle < 150 micron tends to spread out evenly. does this answer the question how particle size affects where it goes? THank you.
-
January 8, 2024 at 9:44 amForum Moderator
It's hard to tell from the image if you've got particle tracks in a recirculation. Are you running transient or steady?
-
January 8, 2024 at 12:35 pmSubscriber
Sorry for confusion. it is a LES simulation.
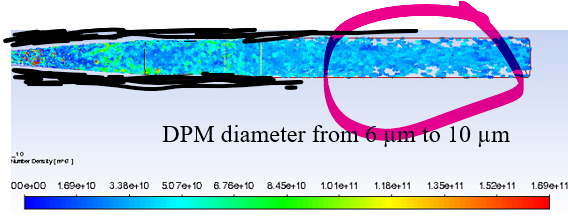
by checking the DPM number density, I found that larger particle like 50-100 micron will reduce gradually in the combustor.
since the mean diameter of the coal particle is 65 micron, the particle number density with the size of less than 10 micron should increase gradually (from upstream to downstream), right?
but it is not consistent.
I don't know how the particle size changes when it loses the mass. there is a variable P_diam(). maybe I will draw the figure to check.
Thank you, Rob
-
January 8, 2024 at 1:02 pmSubscriber
For recirculation, my understanding is: RANS has a setting to stop particles from circulating in one cell forever. (Number of tries)
in my LES case, this one is grayed out.
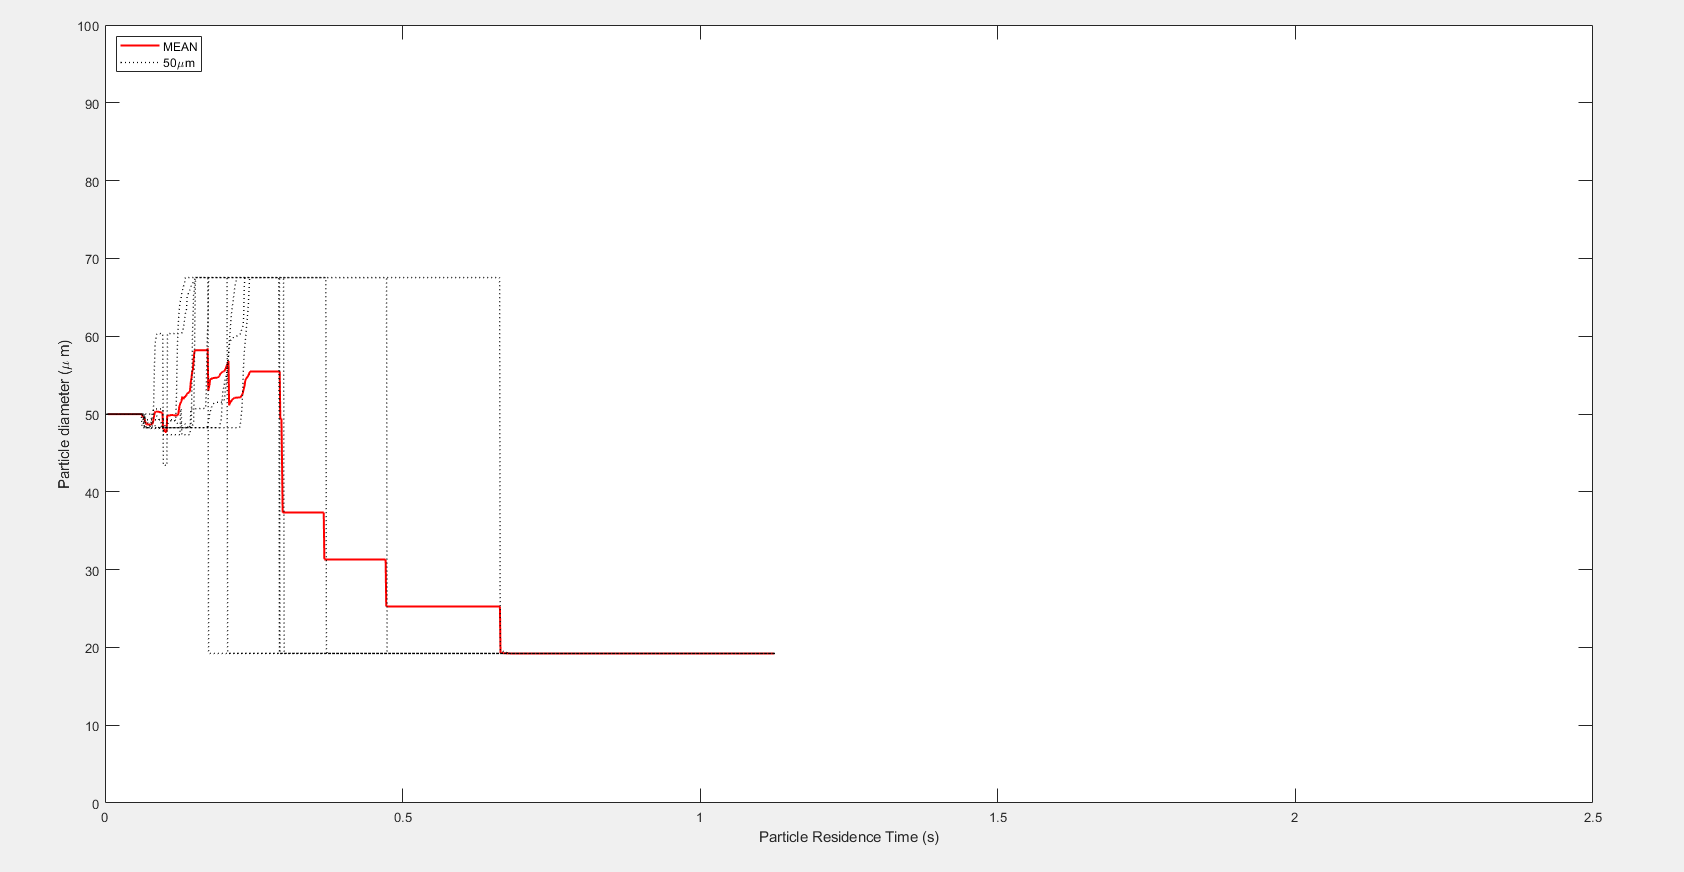
the particle size's final diameter is consistent with my hand calculation, 50 micron reduce to 20 micron (just ash)

-
January 28, 2024 at 6:02 pmSubscriber
particle material's swelling coefficient is set as constant 1.4. 50*1.4=70. That's why the diameter increases.
why it decreases?
"To allow a more adequate description of the char particle size (and hence density) variation during combustion, you can specify the burning mode
 , relating the char particle diameter to the fractional degree of burnout"
I didn't find this in FLUENT.
-
January 28, 2024 at 7:06 pmSubscriber
shrinkage is calculated based on ash mass and ash density.
for the fluctuation in the early stage, why diameter fluctuate? I didn't find this.
-
-
-
January 8, 2024 at 1:16 pmForum Moderator
OK, if it's transient you also need to check the particles reaching the plane have reached an equilibrium. Given burnout etc you may find there's a hold up somewhere so DPM mass is accumulating between the inlet and monitor plane.
Re the image, as I don't know what you're plotting on I can't really comment. If it's the wall/centre plane you may find particles are central or nearer the wall at different positions down the combustor. If you plot particle tracks do you get a clearer result?
-
January 8, 2024 at 1:27 pmSubscriber
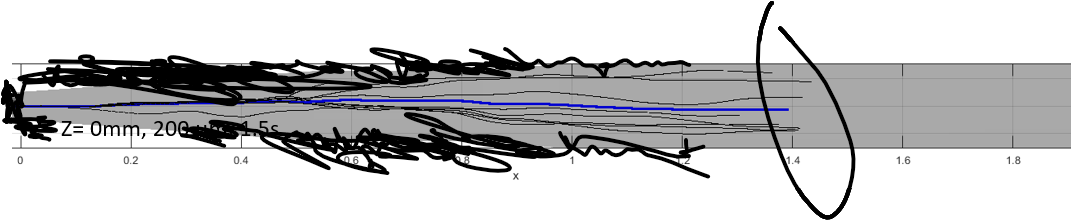
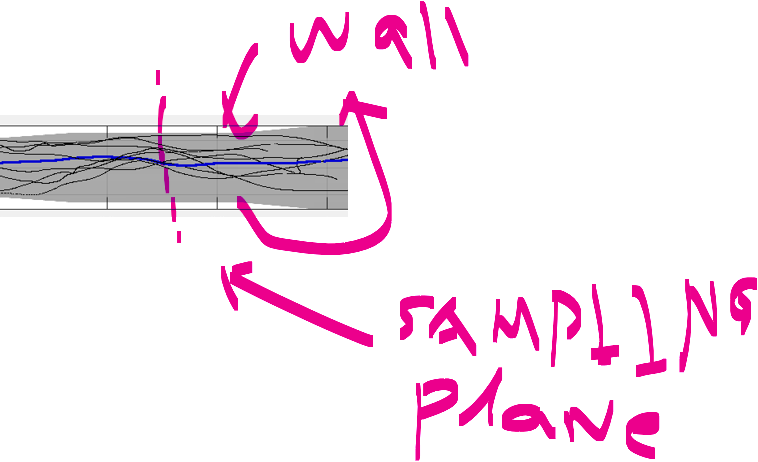
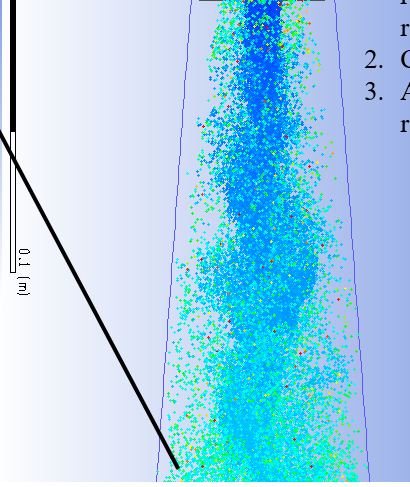
I can only show particle of the geometry. it is a cylinder shape.
this is the side view. particle goes from left to right.
the sampling plane is indicated.
the particle size is 25 micron.
-
January 8, 2024 at 1:29 pmSubscriber
part of the geometry
-
January 8, 2024 at 1:34 pmSubscriber
I don't know how exactly checking the equilibrium. the simulation has ran for several Flow through time, so I suppose it is equilibrium state.
-
January 8, 2024 at 1:56 pmForum Moderator
OK, it looks like the particles are going through the plane once, that helps with post processing as particles aren't counted multiple times.
In a transient case stochastic tries are off as it's assumed the flow field will vary with time so we don't need the artificial option. Also look at the flow to see if you are getting any variations: there may be a swirl effect. I suspect the results are correct (or near enough depending on convergence) and it's now a case of understanding what's going on. You may need contours, particle tracks etc for different time steps to understand what's going on.
Depending on model settings, particles should reduce in diameter as the char is burnt out and then only ash remains.
-
January 8, 2024 at 7:43 pmSubscriber
The swirl effect, or (could I call it "larger eddy" if the velocity is decomposed into mean velocity, phase dependent part and stochastic part)?
if this is what you mean, then that's what I tried to find out.
there is no artificial swirl effect in this combustor.
the particle size against time profile shows that particle size does change with time.
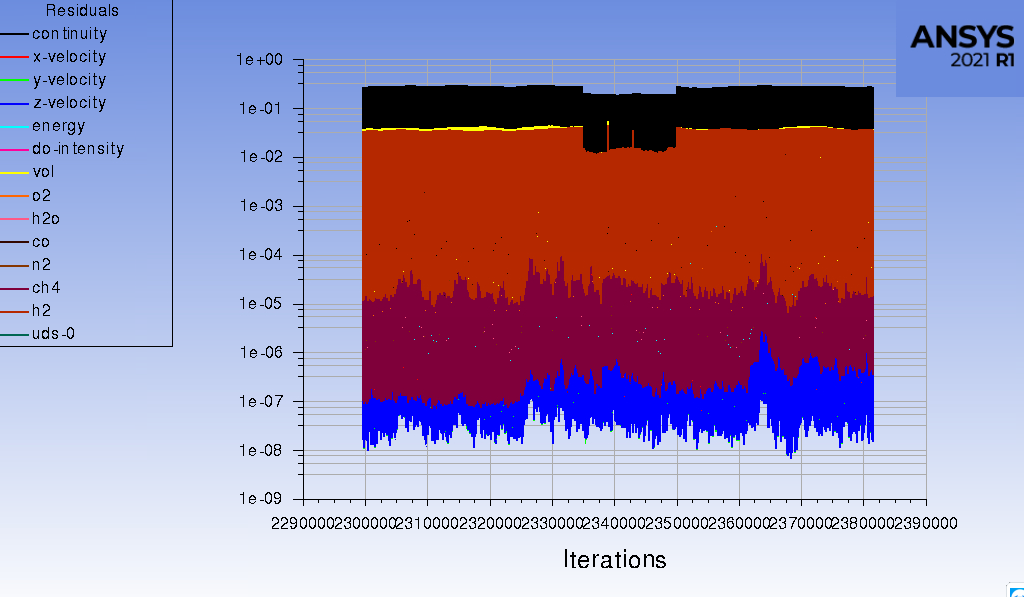
the convergence for continuity is 0.01%.
Based on the particle tracks contour, by filtering small particles < 50 micron, there should be no 200 micron particle in my sampling plane location.
the particle number density tracks contour shows the large particle number density diminishing; however, small particle number density should be increasing in the direction of downstream.
-
January 9, 2024 at 11:24 amForum Moderator
By swirl I meant as in swirl combustors, or if there's a bluff body to stabilise the flame.
As the model is transient you need to be a little careful when post processing to ensure you're acounting for pulsing effects. Ie flow may vary with time.
-
February 2, 2024 at 10:46 pmSubscriber
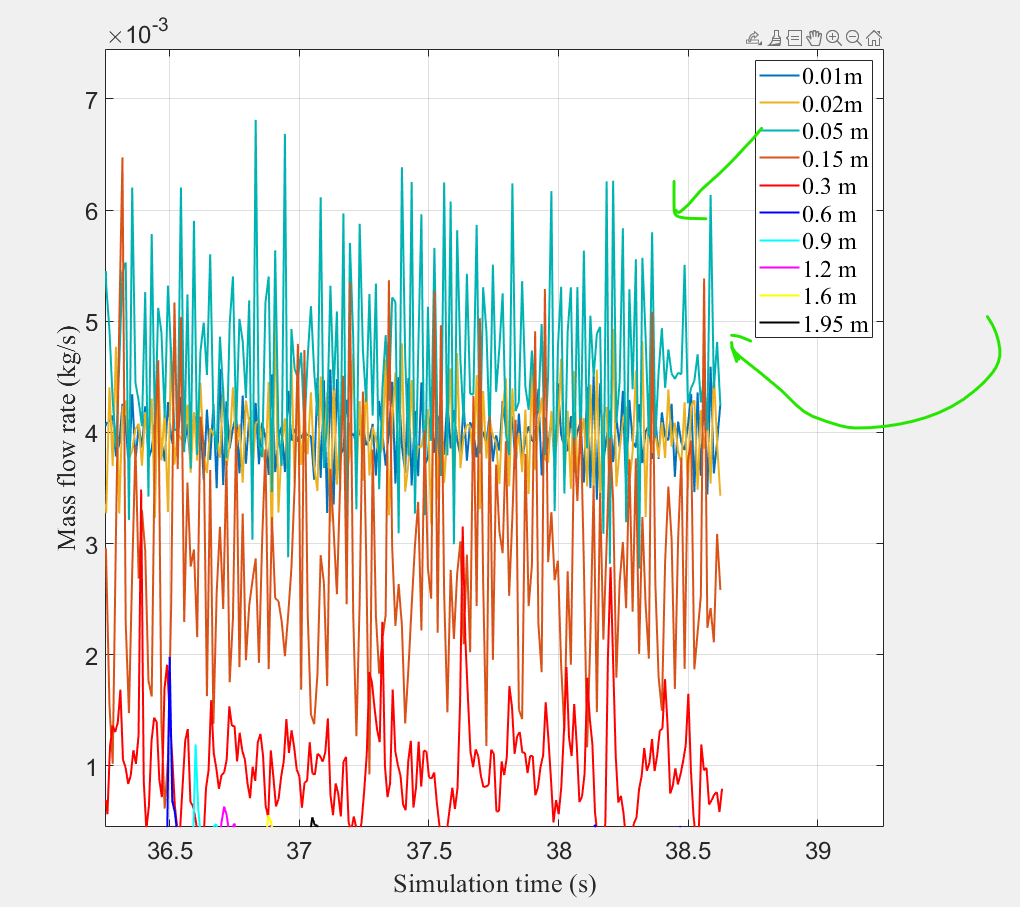
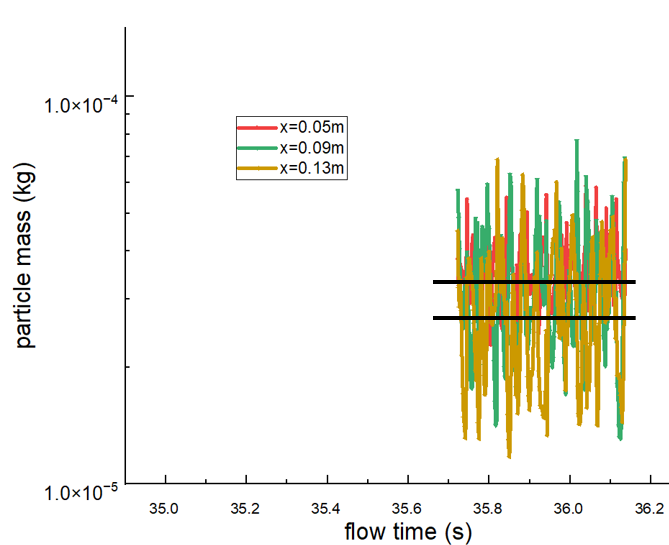
For the pulsing effect, does this lead to higher particle mass flow rate than inlet condition of particle flow rate?
I got a data showing, at the inlet part, x=0.01m, particle mass flow rate is close to that value of inlet condition.
but at X=0.05m. it fluctuates violently. does this mean recirculation and same particles being counted several times?
I need to check particle ID.
-
February 5, 2024 at 9:37 amForum Moderator
Possibly. Look for the particle ID being repeated in the DPM.out file.
-
February 5, 2024 at 2:12 pmSubscriber
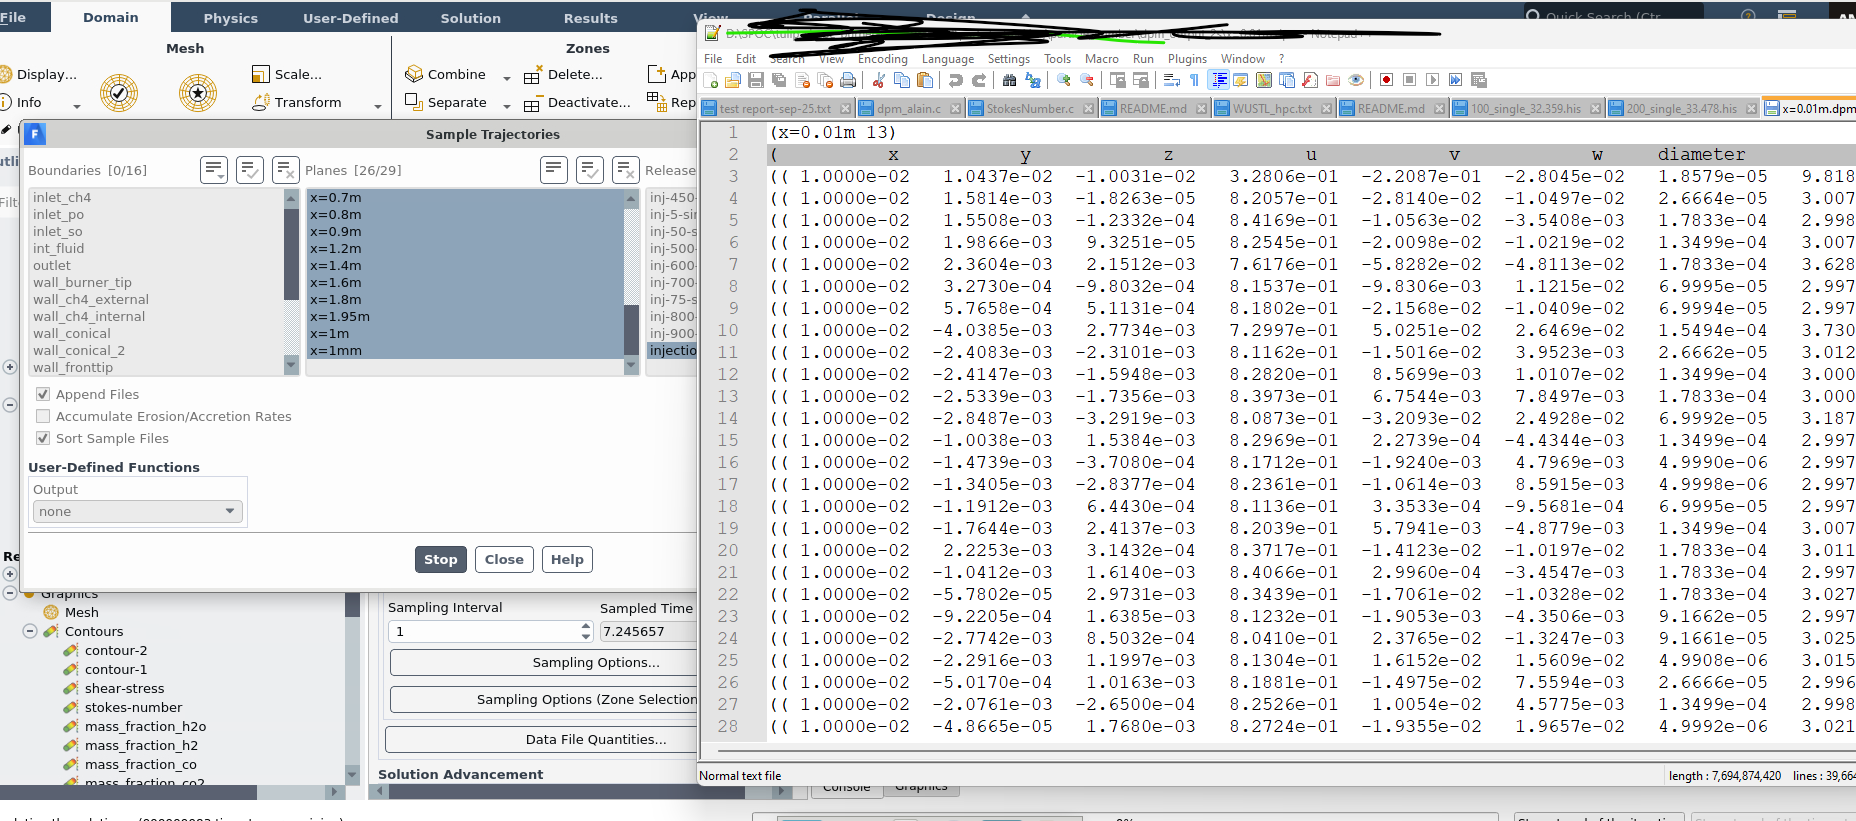
DPM sampling file doesn’t provide particle ID.
( x y z u v w diameter t parcel-mass mass n-in-parcel time flow-time)
I checked the particle residual time through particle tracks.
1.Each point represents a particle parcel (contain a certain number of particles, representing a fraction of particle mass flow rate);2.Color indicates particle residence time;3.A portion of particles stay in the near-burner region about 0.5 second.so that’s why the pulsing effect of particle mass flow rate happens.is my understanding correct?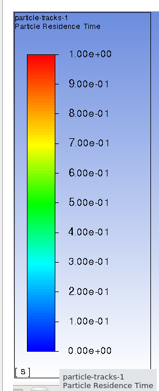
-
February 5, 2024 at 3:04 pmForum Moderator
Odd, there's usually a label in the DPM.out line particle:012 or similar. It'll be on a data line rather than at the header level.
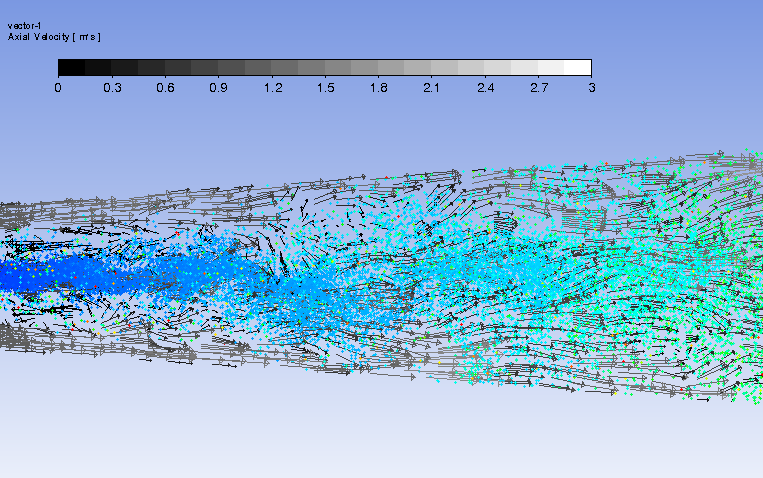
1 & 2, yes. 3, you have older parcels in the domain. Plot a contour to show the flame position & overlay the particles. It's very difficult to say what the particles are doing without the flow data: colouring by "up velocity" (axial velocity) and limiting the scale to + or - can be a good tool too to see what's going in which direction.
-
February 5, 2024 at 4:32 pmSubscriber
temp + particle track

velo + particle
-
February 5, 2024 at 7:02 pmSubscriber
Particle ID didn’t show up. When Sampling starts, no option to choose which variables to include in the data file.
-
February 6, 2024 at 9:57 amForum Moderator
Weird, the post from Jan 6th has the injection ID as the last column.
-
February 6, 2024 at 3:17 pmSubscriber
particle tracks has particle ID variable. but not in DPM file

-
February 7, 2024 at 2:03 amSubscriber
Is the number in the injection column the particle ID?
-
February 7, 2024 at 9:20 amForum Moderator
Yes. It's the injection ID (ie injection-0) and particle ID (big number).
-
February 7, 2024 at 2:00 pmSubscriber
it is a little complex to find the repetitive particle ID. I just checked the 1 time step (0.001s) result. 1 out of 7000 is found. so I assumed recirculation frequency actually not high. the pulsing effect mainly caused by particle "accumulation" at that location.
-
-
-
January 9, 2024 at 4:46 pmSubscriber
Sorry for replying late due to the maintenance of this forum.
there is a bluff body in this combustor. I believe the effect range will be confined to the upstream section.
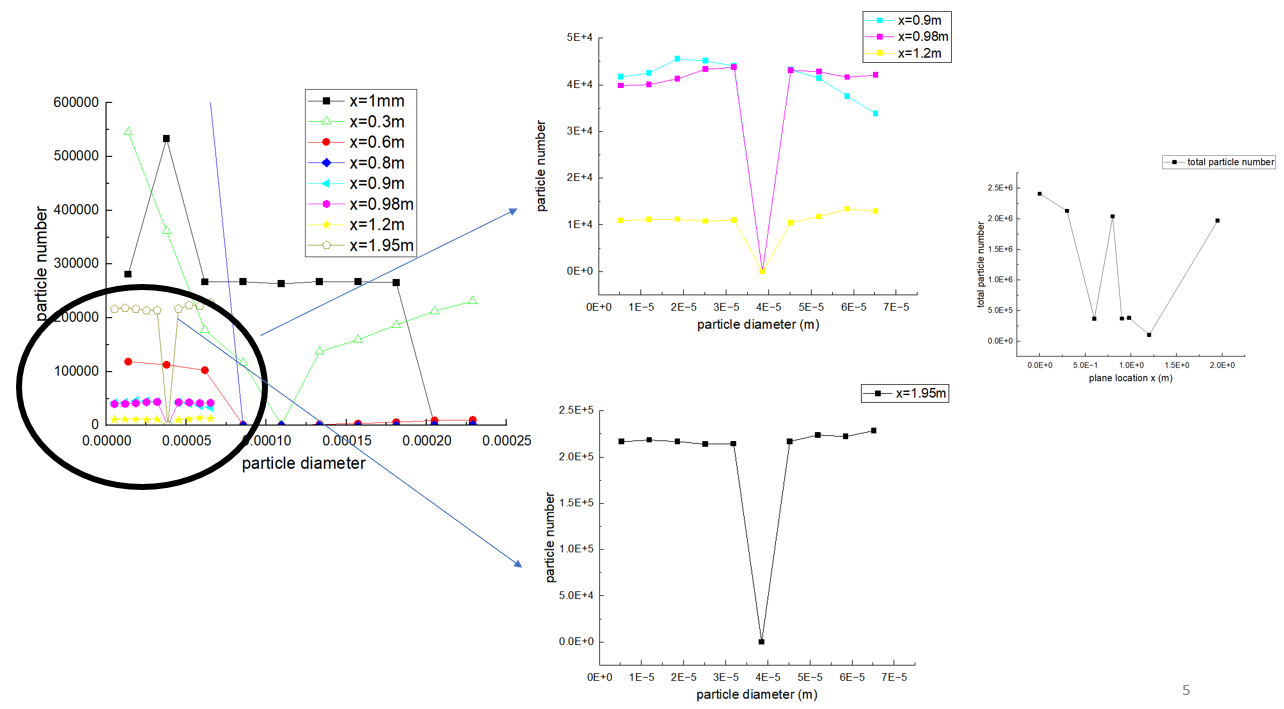
I extracted the particle number data in one figure.
in the very beginning, x = 1 mm, the particle size distribution does not look like the Rosin-Rammler distribution.
in the very end x =1.95 m, the particle size is uniformly distributed under 70 microns.
you can also see there is no particles with 40 micron.
the total number of particle (parcel) also changes.
I sampling this for certain time, the dpm file reaches up to 400 Mb. I am not sure where sampling time is enough.
-
January 9, 2024 at 4:56 pmForum Moderator
If you also review the particle tracks what's going on? You need to use tables etc but also visualise the flow and particle positions. With a bluff body you may find some particles are caught in the lee recirculation zone.
-
January 23, 2024 at 9:31 pmSubscriber
By reviewing particle tracks, the major injection, it includes 40million particle parcel. I have to skip 10000 to show it quickly. since there are so many particles, what I saw is the outerside particle, the inside particle is covered.
I check the summary in particle tracks: the net mass has 8 % error with my input mass of particles.
how to use table to demonstrate the particle info in particle track?
visualizing particles in particle tracks didn't provide reasonable clear info.
-
-
January 9, 2024 at 5:41 pmSubscriber
I have checked this. no particles are caught in the lee recirculation zone. and the recirulation zone is quite small, so it should be a problem.
there is flow time recorded in DPm file. let me run at least 3 seconds to check whether it still show the same.
THank you, Rob, for your help.
-
January 10, 2024 at 9:13 amForum Moderator
Check the particle composition and flowfield too. You won't be the first person to get caught out by longer transients in the flow where the saved data/monitors only picked up some of the information needed to figure out what was happening.
We (Ansys staff) have learnt alot from both our and others mistakes over a lot of years! We can only guide on the Community so can't take files or offer detailed solutions.
-
January 11, 2024 at 3:04 pmSubscriber
I figured out how the weighing works. if parcel weight chosen, then the histogram show the mass percentage of each group of particles. we can call it probability density values.
now it is close to RR distribution. the gap show in the result might be caused by the sampling time. now it is 0.2s. it might need longer sampling time.
Am I now on the right track?


-
January 11, 2024 at 3:51 pmForum Moderator
Possibly, if you're looking at a % and the parcel weights aren't equal the results may be confusing.
-
January 11, 2024 at 4:29 pmSubscriber
Previously you mentioned you had a video to explain particle and particle parcel in the Ansys learning hub, but not for public.
I can't find the money to register there.
particle parcel is a potential issue. actually it is one of the reasons I am stuck here. I tried to find how many particle are moving towards the wall, and what's their weight. then I could predict the potential deposition.
What I understand now: particle parcel represents a typical size of the particle group. Now what I can do is to use this assumption to interpret the result. because even single particles have different weights.
Do you have any suggestions to get rid of the potential confusion?
Thank you.
-
January 11, 2024 at 4:52 pmForum Moderator
The parcel travels as per the particle size, but when it hits something or burns up the mass used is of the parcel. So, your 10micron particle is tracked but may weight 10g when it does something because that's the parcel.
I never use the % functions, and always review weight.
-
January 11, 2024 at 9:20 pmSubscriber
Hi Rob,
This is exactly what I am looking for: to investigate how particle size and mass distributed along the reactive flow.
Here the particle mass with respect to particle size could be obtained, which is what you usually check, right?
then based on this mass function with respect to diameter M(D), the percentage could be extracted (Normalize the data).
it should be the same thing, right?
Thank you.
-
January 12, 2024 at 9:36 amForum Moderator
I suggest running reports based on mass. This also helps if you move onto evaporation etc and need to track escaping vapour mass. Parcel theory is simple once you know, but not easy to figure out and even harder to explain.
It's not helped that the original Fluent model decided to call the parcels "particles" which then was the term used in the TUI reports. The tracked 24, escaped 14 etc.... refers to parcels, but is mislabelled. Given that's now been in the code well over 30 years I very much doubt it'll ever change.
-
January 12, 2024 at 1:12 pmSubscriber
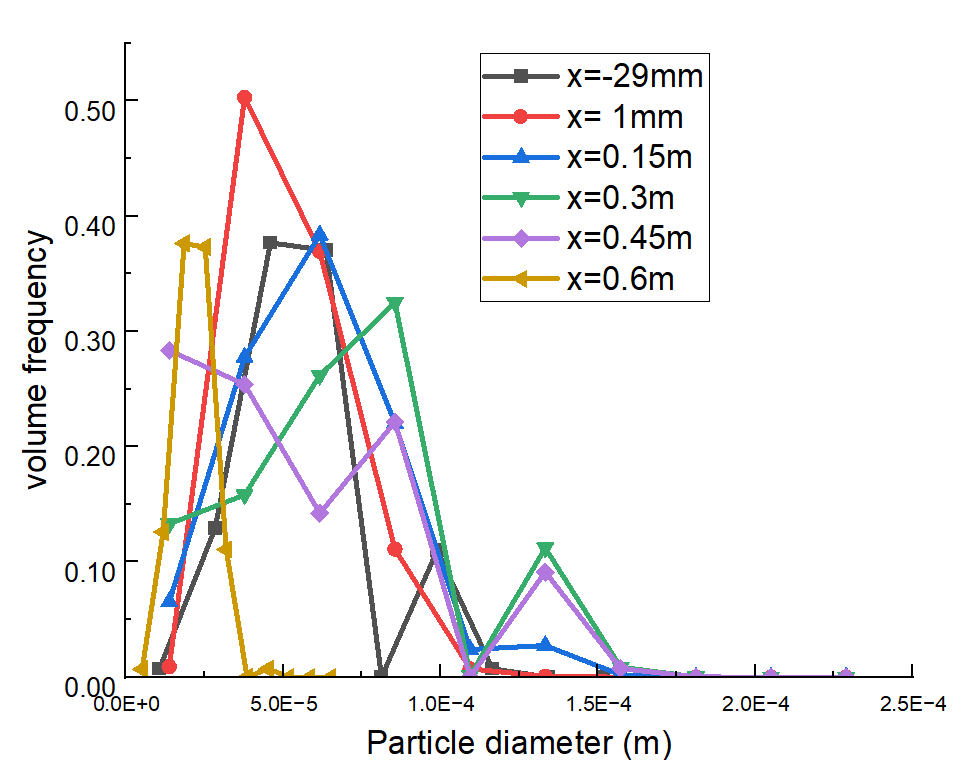
deselect the percent, as you suggested. I am not sure how to explain the bimodal distribution at x= -29mm, then it becomes unimodal at x=1mm, then bimodal at x=0.3m and 0.45m again. (This is the upstream of combustor)
for down stream part, the size distribution should decrease a little bit. but it didn't. the curve results are normalized based on mass weight data.

-
January 12, 2024 at 2:56 pmSubscriber
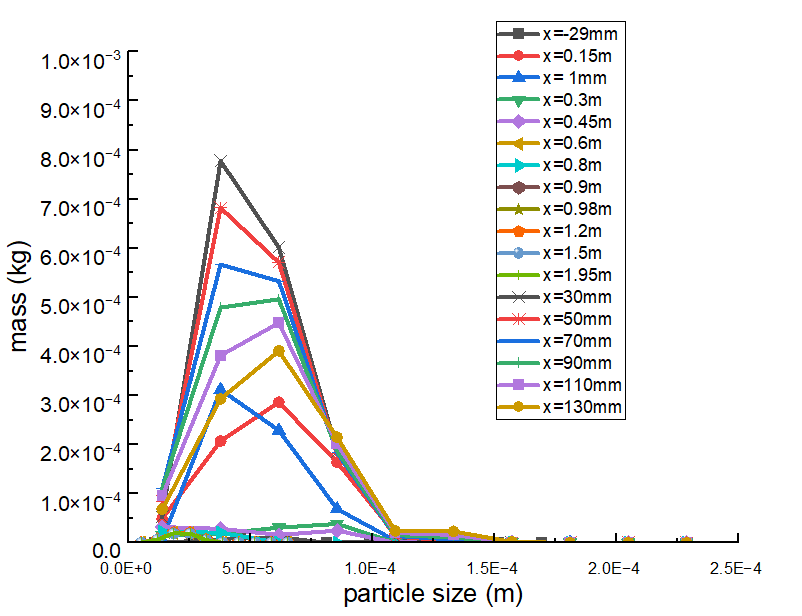
Rob, you are right about using the mass.
the figure below shows the mass of particles at different sections along the combustor.
in the beginning, x=-29m, particle is just released, so only 1 injection particle mass is sampled.
x=1mm and x=0.15m, particles are just concentrated near the burner, so the mass is built up there.
then the reaction goes on and the mass keeps decreasing.
in this sense, the results show the right trend.
As to how to explain the bimodal distribution, it might show the weakness of the code in this aspect. Am I now understanding you correctly?
Thank you.

-
January 12, 2024 at 3:09 pmForum Moderator
Or it means you need more parcels in the system? How many are you tracking?
-
January 12, 2024 at 3:42 pmSubscriber
I don't find the way to get the number of particle parcel in the panel of Trajectory Sample Histogram.
I only know when I injected 10 particles individually, then I can know the tracked particle number
-
January 12, 2024 at 3:52 pmForum Moderator
Check what the TUI is telling you when the DPM part updates. It should say something about injected particles (parcels!).
-
January 12, 2024 at 4:01 pmSubscriber

-
January 12, 2024 at 4:03 pmSubscriber
45 million
-
January 12, 2024 at 4:20 pmForum Moderator
That should be enough. And if you create more report surfaces around the peak area?
-
January 13, 2024 at 2:08 pmSubscriber
I will set up more plane between x =1mm and x=0.15m.
-
January 14, 2024 at 5:57 pmSubscriber
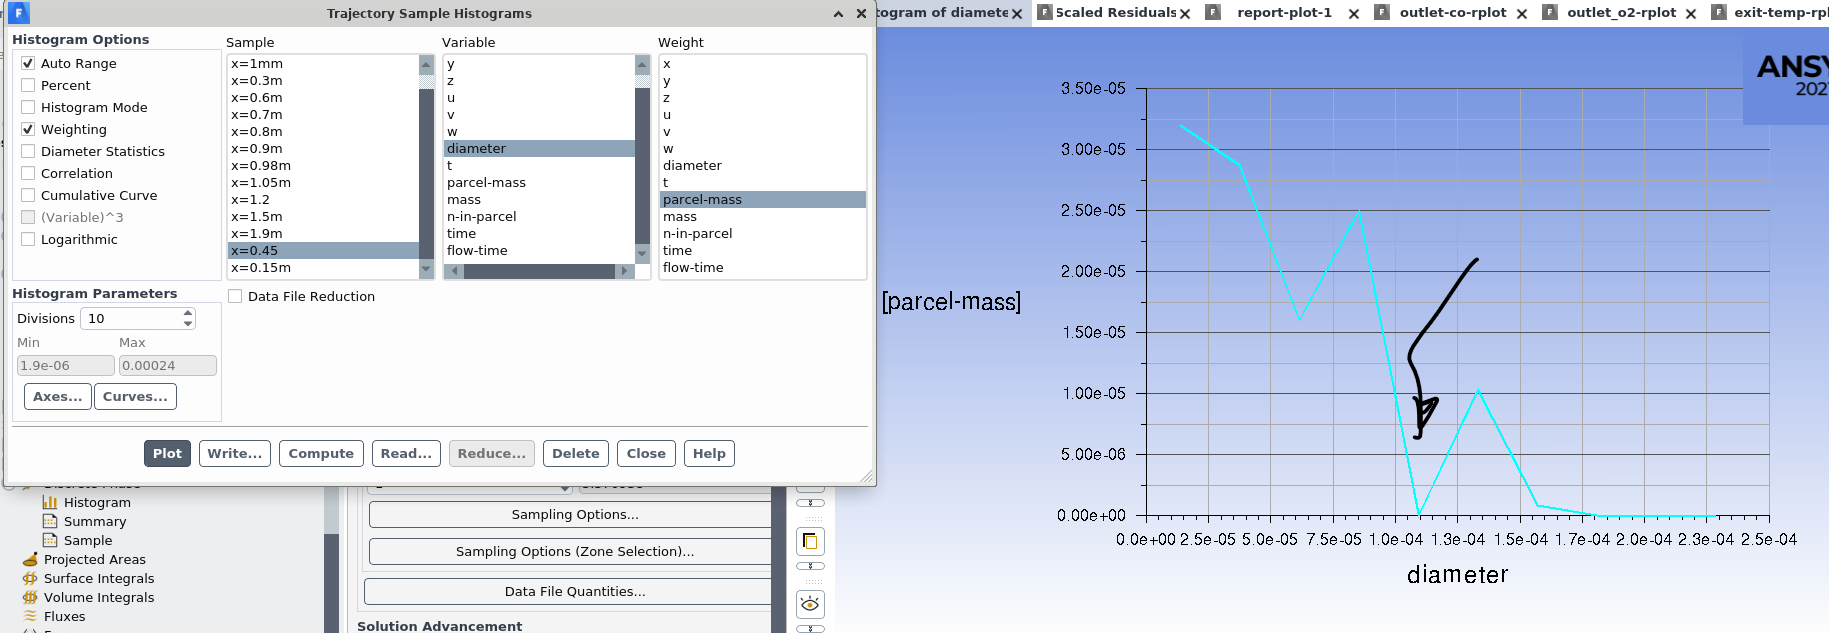
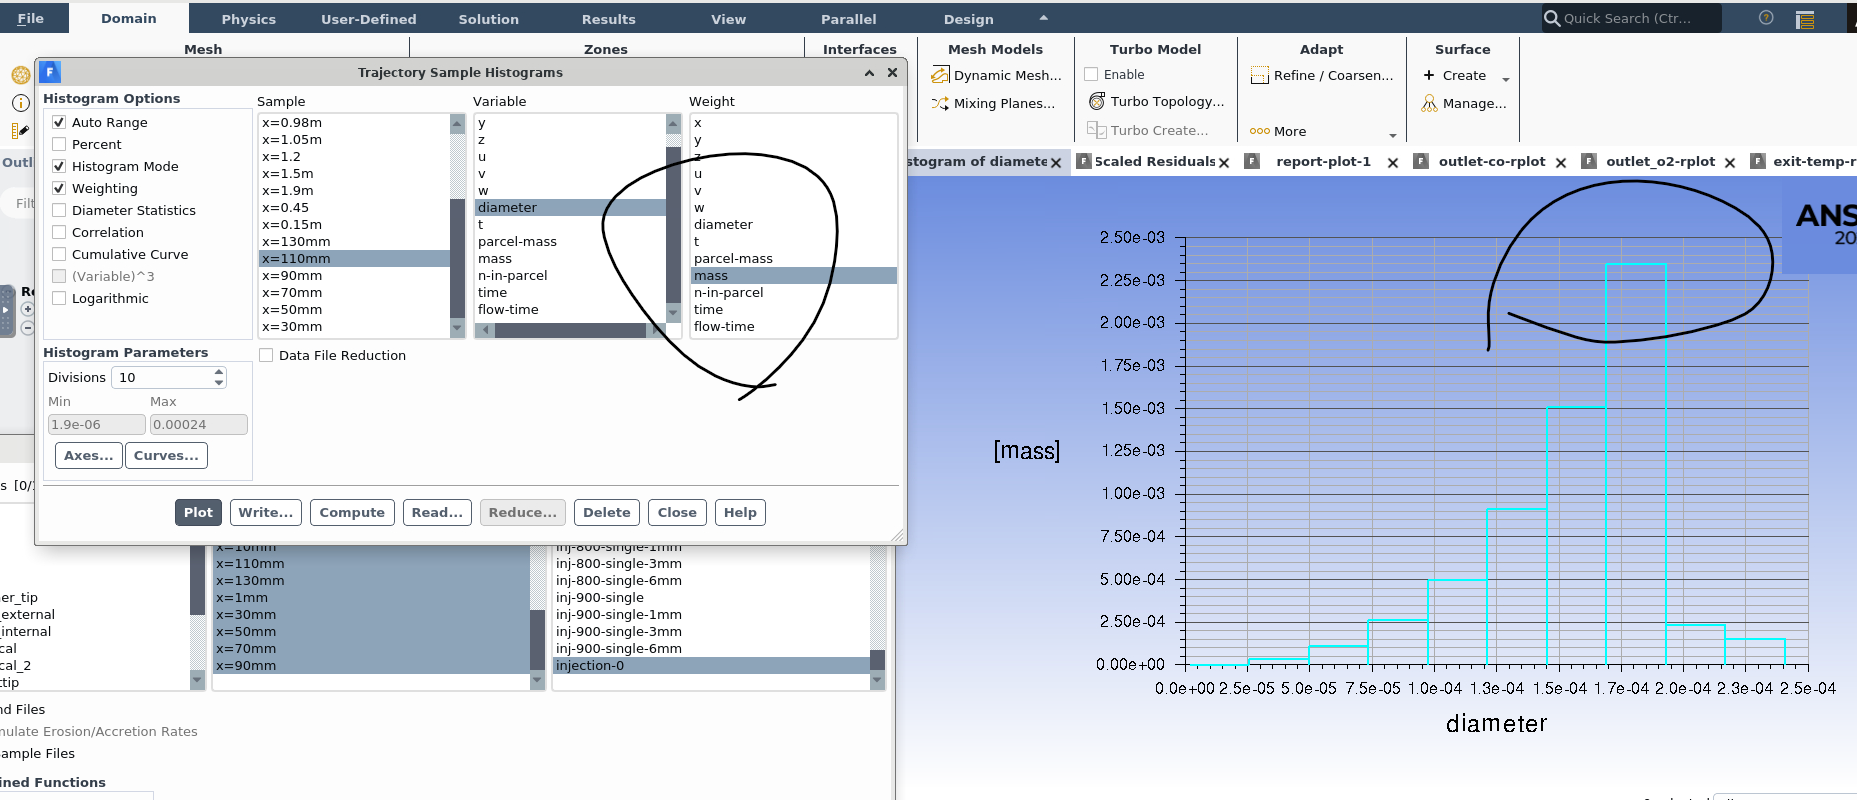
it shows the parcel-mass against particle size quickly decreases.
I am not sure how the weight works in the histogram figure. based on the figure, I guess it shows the mass distribution of particle with respect to particle size.
if I choose the mass in the weighted field variable, then the max value is for diameter 140 micron.
How does this weighted field variable work?
Thank you.
-
January 15, 2024 at 9:34 amForum Moderator
If you click on Help on that panel you should find links to everything on that panel.
-
January 15, 2024 at 6:08 pmSubscriber
Hi Rob, I only find this explanation. nothing else.
I didn't find any formula in the manual of ansys fluent user guide and fluent theory, which could help me to understand the algorithm.
could you please help me to check where I can find them?
Thank you.

-
January 16, 2024 at 11:30 amForum Moderator
Just this by the looks of it https://ansyshelp.ansys.com/account/Secured?returnurl=/Views/Secured/corp/v241/en/flu_ug/flu_ug_sec_discrete_post.html%23flu_ug_histogram_reporting
-
January 16, 2024 at 3:43 pmSubscriber
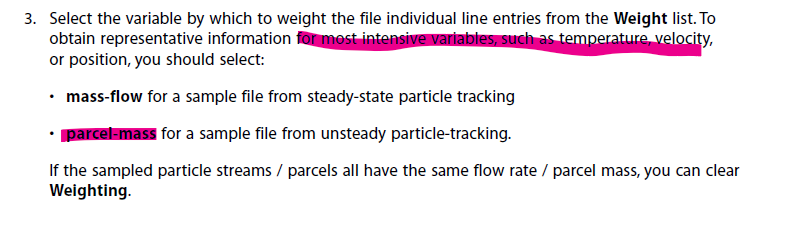
I found a guideline: to get representative info, parcel-mass as weight should be chosen for unsteady particle-tracking.
my result shows parcel-mass decreases when flow moving downwards.
How do I know this mass decrease is due to particle number decrease in a parcel or particle mass loss?
I didn't find further decription about what the weight means.
Thank you.
-
January 16, 2024 at 4:47 pmForum Moderator
Remember parcels are numbers of particles. Hence why I would also look at particle size with position, and use multiple injections of a single size: it's then very easy to visually see the diameter change in the model.
-
January 17, 2024 at 5:38 pmSubscriber
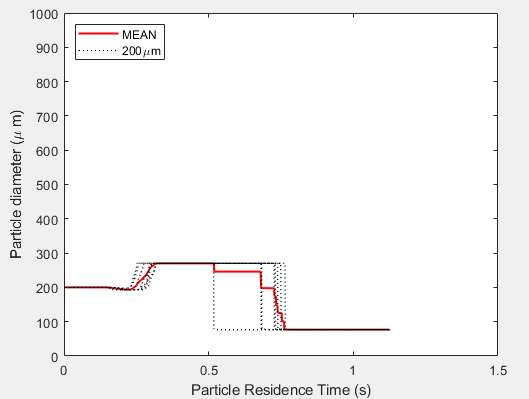
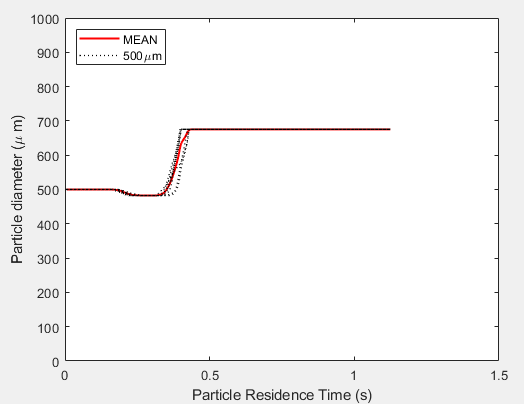
I am trying to fully understand what you mentioned here. the diameter change could be visualized. I found an interesting thing that 500 micron particle size increases but not decreases in this 1.2 second. maybe the time is not enough to consume all of the particle combustible material.
I will try to find out how fluent managed to predict this diameter change in the manual.
I will also need to figure out how to comprehend the sampling result:
- Is the parcel mass in the figure the total mass of the sampling time, or just the average mass during this time? I think it should be average mass during sampling time.
- Why the parcel mass at x=-29mm is much less than x=30mm? I think it is due to the particle accumulation in the combustor.
- Is the particle losing its mass mainly in the burner section? as shown in my last reply.
Thank you, Rob.
-
January 18, 2024 at 9:05 amForum Moderator
If you plot the injection and colour by diameter for a single diameter injection it's fairly easy to see how the particle shrinks along it's trajectory. With a RR injection it's less clear as there are many initial sizes to keep track of.
I'm not able to offer specific advice, but.... Particle accumulation in a burner is possible: you are adding swirl & bluff bodies for the flame stabilisation and particles follow the flow. Use images, we include things like the DISPLAY button in DPM Tracking for a reason! In an experiment you'd film everything, why not the same in CFD?
I don't know all of your settings, check the Laws if you're using them, or are you also including collisions? Those could explain the diameter.
-
January 22, 2024 at 2:06 pmSubscriber
I used DPM model, so no collisions were included.
I think DEM includes collision prediction.
-
-
January 18, 2024 at 5:50 pmSubscriber
Let me try to use the dpm tracking for the sampling particles.
Thank you, Rob, I will post the result if I figure out to show how particle shrinks along its trajectory.
-
January 19, 2024 at 12:15 pmSubscriber
For your suggestion, I checked my simulation result about the single particles; now they moved out of the system and I can't get any figures. Previously what I could see is 10 particles moving across the space. but I can't see a continuous change of particle size along the trajectory, since I am running LES. so in Fluent, it only shows one data for that specific time.
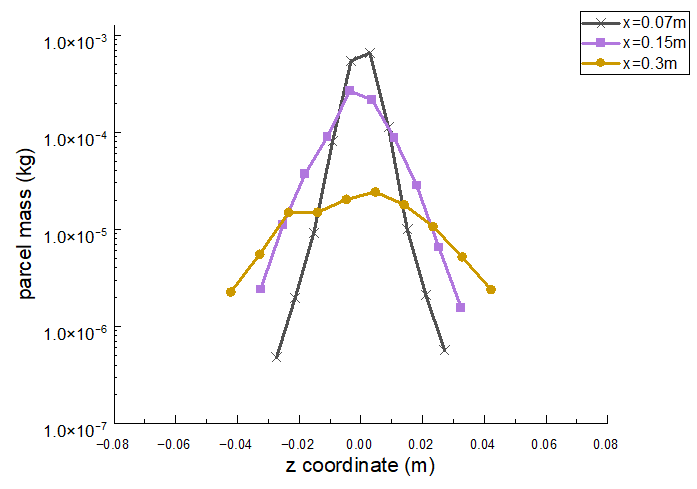
I extracted the parcel mass by sampling. From x=0.07m to 0.15m, the mass didn't change much.
but from x =0.15m to 0.3m, it changes about one order of magnitude. it is impossible for the coal particles being consumed in such a short distance, since the ash content is about 10% (mass fraction).
what I can read from this figure is the particle mass is concentrating in the center of the cylinder; does this statement make any sense to you?
Could I read in this way? or do I have to use single particle data to check where and when the particles are burnout?
how to make sense of This figure from mass conservation?
Thank you.
-
January 19, 2024 at 2:02 pmForum Moderator
It's possible, how do the particle tracks and contours of DPM Concentration support that idea? Note, DPM Concentration is not quite what you may expect so read the definition.
-
January 19, 2024 at 2:39 pmSubscriber
DPM concentration (in the Discrete Phase Variables... category) is the total concentration of the particles in all phases in a cell.
When I use this variable, I face an issue is: I cant eliminate cell size's impact on this result. so I can't not say the DPM concentration is high because there is more dpm mass there. maybe it is just the cell's impact.
-
January 19, 2024 at 2:52 pmForum Moderator
Hence me suggesting you check the definition.
-
January 19, 2024 at 4:00 pmSubscriber
I don't understand what you meant.
is the parcel mass figure I showed based on DPM concentration? if so, then I don't know how to interpret it? I can't organize the data well from particle track, dpm concentration contour, this particle plane sampling, and single particle sampling. I need a mental structure to organize them and try to find useful info. I will think about it.
Thank you, Rob
-
January 19, 2024 at 4:10 pmForum Moderator
DPM Concentration is based on parcel mass.
-
January 19, 2024 at 4:49 pmSubscriber
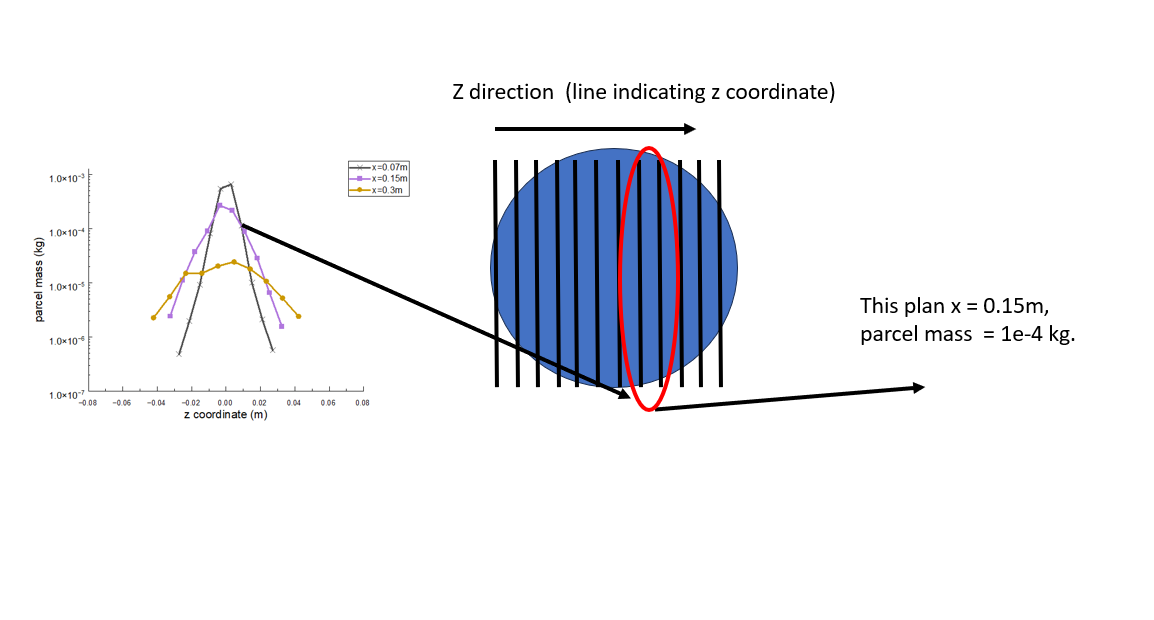
look at x=0.15m plane. at z = 0.02m, parcel mass is 1e-4. does this mass obtain from the summation of all cells circled by red line during the whole sampling time or averaged by time?
the parcel mass used in histogram sampling doesn't show the unit. I assume it is kg.
I can't find some bench mark to compare. I can't tell it is right or wrong.
-
January 19, 2024 at 5:12 pmForum Moderator
If it’s from the DPM.out files it should be sampling time. How does it compare with what you're expecting to see?
-
January 19, 2024 at 5:19 pmSubscriber
the area ration of x =0.07m and 0.15m is 1:1.39, so the mass/area can make up for 1/1.39= 30% shrinkage. is this why?
-
January 19, 2024 at 5:22 pmSubscriber
"If it’s from the DPM.out files it should be sampling time. How does it compare with what you're expecting to see?"
if it is time-averaged value of the parcel mass, each plane should be quite stable at different time point. but to compare with the plane before or after it, then plane area has impact on the result.
-
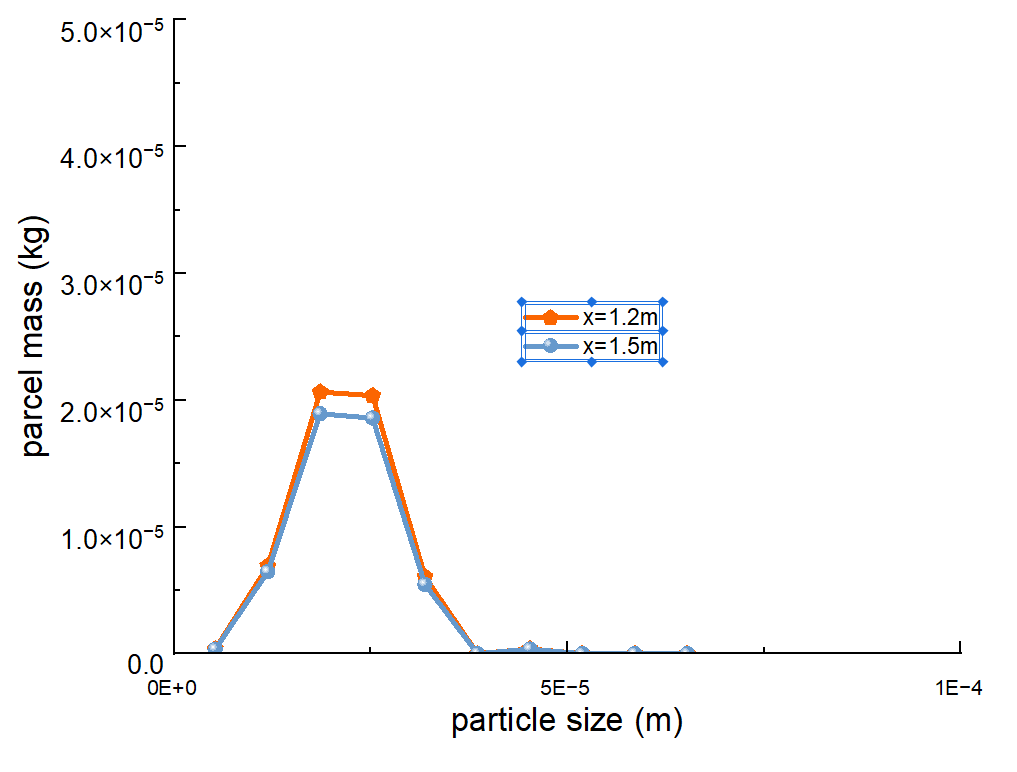
January 19, 2024 at 5:30 pmSubscriber
by testing this idea, 1.2m and 1.5m are chosen (same areas). 1.5 m parcel mass should be a little bit lower than 1.2 m due to char combustion. the difference is 2 e -6 kg or kg/(s*m2). it does make some sense.
-
January 22, 2024 at 2:15 pmForum Moderator
I'd not expect the sample surface area to alter the DPM.out data as it will return kg or kg/s (dependent on the report): assuming the plane is the whole cross section and everything flows through all planes.
-
January 22, 2024 at 2:58 pmSubscriber
if parcel mass is not dpm concentration (kg/m3), then the difference of the masses at different planes is caused by the particle combustion (evaporation, devolatilization, char burnout ) and particle recirculation (the same particle passes the same plane several times)
and particle accumulation (particle stays in certain region for a long time due to direction change ie. winding route). the dpm.out sampling data will only provide the combination effect, can NOT show the effecto of particle combustion and particle recirculation individually.
-
-
January 22, 2024 at 3:15 pmForum Moderator
The surface reports (flow) are based on the fluid phase. The .dpm reports are particle (parcel) related and include any particles passing through that surface/plane.
-
January 22, 2024 at 4:08 pmSubscriber
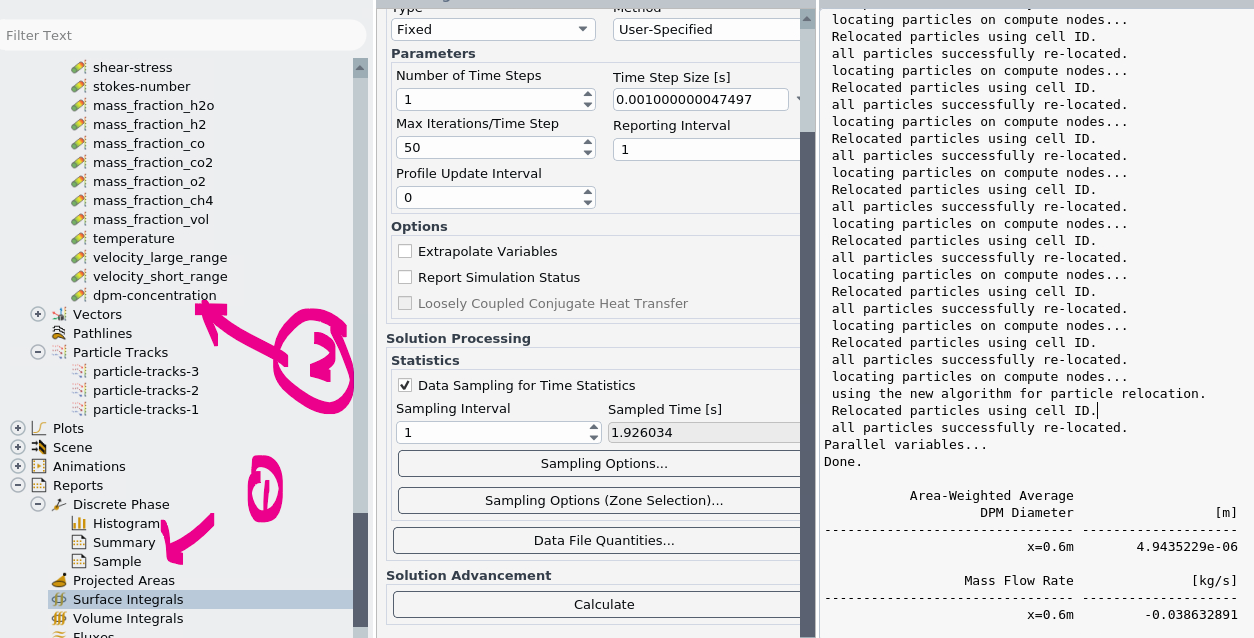
let me double check, Discrete phase-> sample get .dpm report, include any particles passing through the surface, so the result is dependent on plane locations, see 1 in the figure.
in the contour DPM concentration, it calculates dpm concentration in a cell (the cell volume ~= gas volume), so the result is dependent on cell size. see 2 in the figure.
If my understanding is correct, then the parcel mass differences from sampling result (.dpm file) still could be explained by the spread-out of the plane, because the curve's x axis is z-coordinate.
Circulating Fluidized-Bed Boilers
-
-
January 22, 2024 at 4:27 pmForum Moderator
DPM Concentration is kg particles per m3 of cell. So is very mesh dependent.
DPM.out reports any particle crossing the surface, so can include particles multiple times if they cross a plane in a recirculation zone.
Hence we use graphs, and images to figure out what's going on: and why I've asked for images in a few of my posts.
-
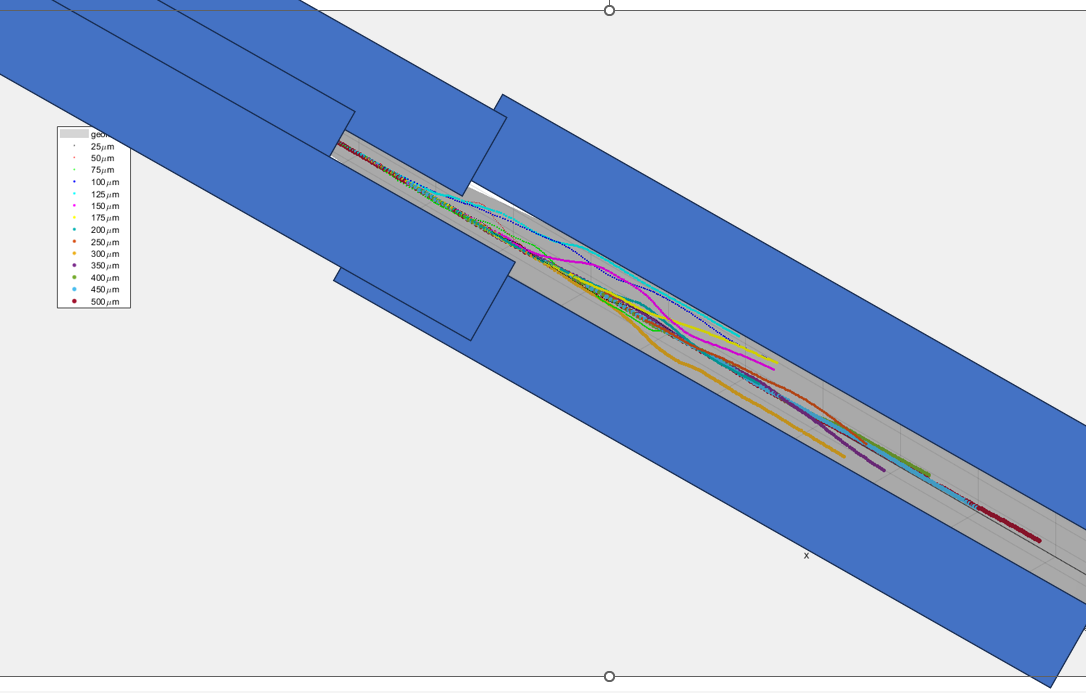
January 22, 2024 at 4:45 pmSubscriber
Thank you for this reminder and sorry I have to cover the shape. this is a cylindrical shape with area changes in a few regions.
particle trajectory with different size is extracted.I will post the figure for other parameter like char burnout later
-
January 22, 2024 at 5:04 pmForum Moderator
Just a reminder, Academic licences shouldn't be used unless the results are being published: check the T&Cs for full details on the licence use.
-
January 22, 2024 at 5:24 pmSubscriber
Did I violate the rule of using Academic license?
-
January 22, 2024 at 5:45 pmSubscriber
I have checked the T&C.
These products may be used only for degree and/or nondegree-related research, student instruction, student projects and student demonstrations.
Product references should be accompanied by the release version. Refer to your product license form for the correct product name.
Do I need to do this in this forum?
-
-
-
January 23, 2024 at 9:51 amForum Moderator
You don't need to reference the version on here. My comment relates to you blocking out some of the geometry - that tends to be something a commercial user would do to hide some design details. If it's research, and therefore will be published then all good. If it's private research for a company (ie you're an academic doing work for the commercial entity) please talk to your account manager.
If you're a commercial user and have TECS (paid for support) you can contact the local team directly so all conversations are private so we can offer a lot more assistance.
Note my comments do not override the legal T&Cs. They are the Ansys legal standpoint.
-
January 23, 2024 at 12:58 pmSubscriber
This research is academic. This design is for prototype design, still in process and not ready to be published yet. the last figure I posted is postprocessing Fluent data in Matlab. I am not fully knowing the IP situation of the design. I need to cover it.
-
January 23, 2024 at 1:02 pmForum Moderator
No worries. We do need to check on occasion.
-
-
January 23, 2024 at 1:10 pmSubscriber
Thank you for reminding me about this.
-
January 24, 2024 at 9:05 amForum Moderator
Please can you post an image? If the "outer" particles are masking the "inner" ones it suggests you may have mass stuck in the flow boundary layer. Hard to tell without looking.
-
January 24, 2024 at 12:43 pmSubscriber
The figure shows part of the combustor. the boundary layer could be a problem. I didn't find a way to check whether particles are stuck there. the line is the wall.

-
-
January 24, 2024 at 1:12 pmForum Moderator
Not easy, you'll have to look at different views and see how it behaves. Colouring by radial postion (you may need to use a Custom Field Function of SQRT(x^2+y^2) ) to help.
-
January 24, 2024 at 2:51 pmSubscriber
We actually did some work for potential boundary layer trapping. the boundary layer was intentionally avoided when injecting particles. this work is modeled by RANS model.
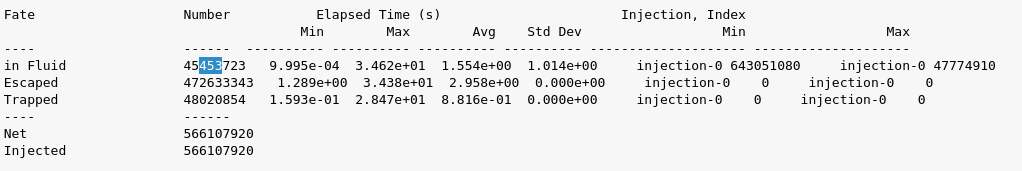
I have checked the particle mass balance, comparing the value of particle mass injected from FLUENT and the input value of 34 seconds injection. 8% error was found.
I also checked the particle parcel number. 3 seconds is flow-through time, you can see Escaped number is 472,633,343, is about 11 times of 45,453,723; and the simulation time is 34 s. roughly speaking, most particles are behaving normally. if there is a small amount of particles stuck in the boundary layer, I suppose it shouldn't be a big deal; is this assumption reasonable to you?
I could generate some animation of particle based one the figure I posted in the previous reply. We can get some overall impression, but not detailed info. Do you think it will be informative?
I will extract some results of particle movement in the near-wall region for LES modeling.
Thank you for your suggestion.
-
January 24, 2024 at 4:57 pmForum Moderator
I'm a little stuck answering - I'd need a lot more detail/data to confirm results are good, and I'm not allowed to do that based on the forum rules. If you're reacting/evaporating mass and the bulk of the missing DPM mass is in the gas phase that's a good sign.
In terms of the parcel count, have you reached a point where the injected mass is balanced by what's leaving?
-
January 24, 2024 at 5:46 pmSubscriber
the continuity residual could reach down to 1e-4 in 50 iterations per time step. more iterations didn't lead to a lower value.
based on Flux report, 4% error is for mass balance.
the simulation now is stable and is also verified by the experiment that flame is stable. so LES simulation should reflect what's going on in the combustor.
-
-
January 25, 2024 at 9:25 amForum Moderator
Which sounds like a fairly good defence of your results. As it's transient I'd monitor the mass flow over some time to check for pulsing effects, but I'd expect a well designed combustor to be fairly stable.
-
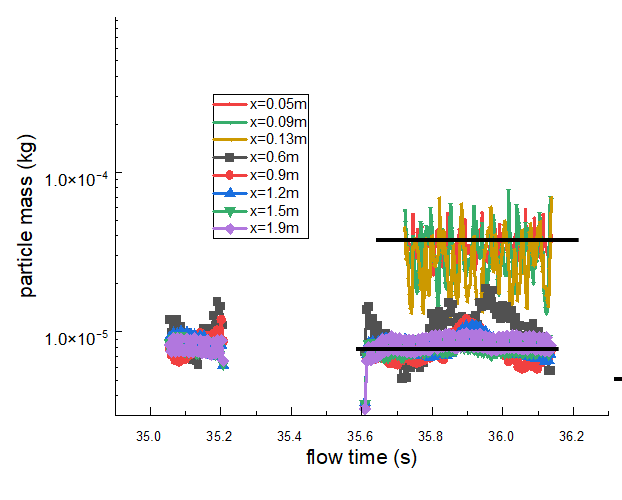
January 25, 2024 at 1:46 pmSubscriber
particle mass over time is extracted. The mass change now looks reasonable. it did show the pulsing effect.
Thank you, Rob. I think I am almost getting there.
-
-
January 25, 2024 at 2:10 pmForum Moderator
You're welcome.
-
January 29, 2024 at 9:50 amForum Moderator
I think I found the posts. Particle diameter should decrease with burnout, ie as mass is transferred to the gas phase. Check the combustion Law section (there are 6 laws) as I think it's covered there.
Please don't add posts part way through a thread, it's not always easy finding them!
-
January 29, 2024 at 1:20 pmSubscriber
Ok. I will start a new thread if I have new questions. Thank you, Rob.
-
- The topic ‘particle size distribution in histogram is not continuous’ is closed to new replies.


-
peteroznewman
 5794
5794 -
scabo
 1906
1906 -
Dennis Chen
 1419
1419 -
javat33489
 1305
1305 -
Shyam Prasad V Atri
1021


© 2026 Copyright ANSYS, Inc. All rights reserved.
