

-
-
May 29, 2021 at 3:33 pm
HalimBishoy
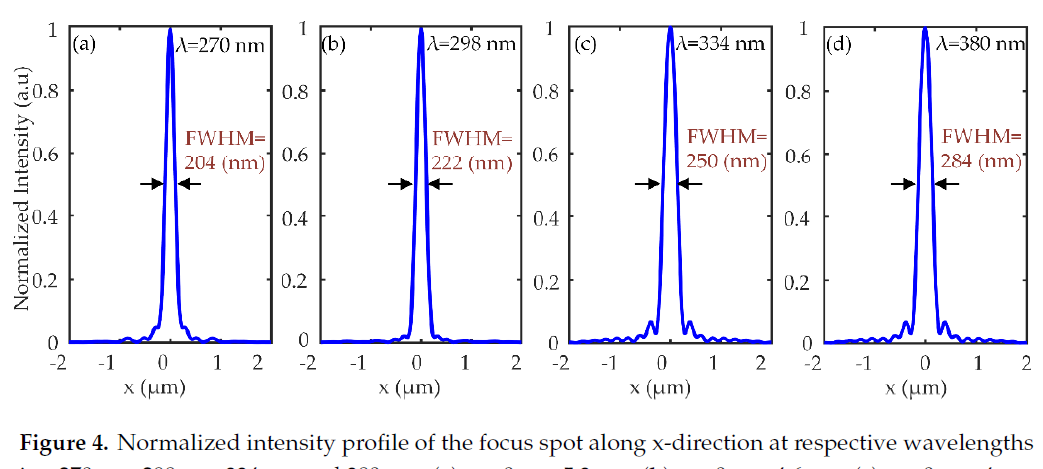
SubscriberIf I generate a metalens at broadband 270nm to 380nm. Could I ask about script code to get the normalized intensity as shown in the following figure with a max value equal to one, at different wavelength values (for example 270nm, 298 nm , 334nm , and 380 nm) in that range?
June 1, 2021 at 3:29 pmGuilin Sun
Ansys EmployeeHi, I think this question appears in different posts. However I do not know what quantity you have at hand in script. In general, you can get the the intensity by use of
E2=getelectric("monitor")
This is in general a 4D matrix: x,y,z, and f, even some of them has only one element, eg, for a 3D simulation, a 2D DFT monitor perpendicular to z axis, E2 would have (please pick up x,y,z, and f from the monitor using script)
nx=length(x)
ny=length(y)
nz=length(z), which is 1
and
nf=length(f).
In order to plot the graph shown above, you will need to find the y value. For example, at y=0, you can use
E2_x=pinch(E2(:,find(y,0),1,2)) This script picks up the 2nd frequency point (4th dimension), and y=0 plane.
Then you can plot
plot(x*1e6, E2_x,"x um","E2");
You can also plot the normalized result with max=1:
plot(x*1e6, E2_x/max(E2_x),"x um","E2");
Please refer the script introduction website and related edu videos for more information.
Viewing 1 reply thread- The topic ‘Normalized intensity’ is closed to new replies.
Innovation Space Trending discussions
 Top Contributors
-
peteroznewman
 5799
5799 -
scabo
 1906
1906 -
Dennis Chen
 1420
1420 -
javat33489
 1305
1305 -
Shyam Prasad V Atri
1021
Top Rated Tags
© 2026 Copyright ANSYS, Inc. All rights reserved.
Ansys does not support the usage of unauthorized Ansys software. Please visit www.ansys.com to obtain an official distribution.
-


The Ansys Learning Forum is a public forum. You are prohibited from providing (i) information that is confidential to You, your employer, or any third party, (ii) Personal Data or individually identifiable health information, (iii) any information that is U.S. Government Classified, Controlled Unclassified Information, International Traffic in Arms Regulators (ITAR) or Export Administration Regulators (EAR) controlled or otherwise have been determined by the United States Government or by a foreign government to require protection against unauthorized disclosure for reasons of national security, or (iv) topics or information restricted by the People's Republic of China data protection and privacy laws.
